Creating and Customizing Area Charts
An Area chart displays a series as a set of points connected by a line with the whole area filled in under the line.
Area charts are appropriate for visualizing data that fluctuates over a period of time and can be useful for emphasizing trends. Values that don't vary too wildly work best for Area charts.
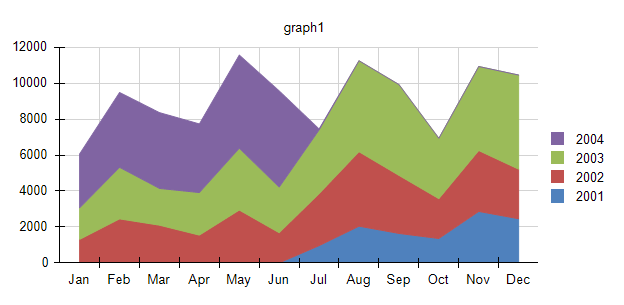
The following image shows an example of a Stacked Area chart:
Types
The Graph supports the following Area chart types:
- Stacked Area Charts—An Area chart where multiple series are stacked vertically. If there is only one series in the chart, the Stacked Area chart will appear in the same way as an Area chart.
- 100% Percent Stacked Area Charts—An Area chart where multiple series are stacked vertically to fit the entire chart area. If there is only one series in the chart, the Stacked Area chart will appear in the same way as an Area chart.
- Smooth Area Charts—An Area chart where the data points are connected by a smooth line instead of a regular line. Smooth Area charts are suitable for displaying trends rather than values of individual data points.
Creating Area Charts with the Area Chart Wizard
In this section, you will learn how to create an Area Chart with the Telerik Reporting Area Chart Wizard. For the purposes of this guide, the Area Chart will be Stacked and will compare the total monthly sales by years. The final report will look like the image above.
The sample report will use a pre-defined SqlDataSource that connects to the example AdventureWorks database. The query that returns the needed fields is the following:
SELECT
    [Sales].[SalesOrderHeader].[OrderDate],
    [Sales].[SalesOrderDetail].[LineTotal]
FROM
    [Sales].[SalesOrderDetail] INNER JOIN
    [Sales].[SalesOrderHeader] ON [Sales].[SalesOrderDetail].[SalesOrderID] = [Sales].[SalesOrderHeader].[SalesOrderID]
To create the Stacked Area chart by using the Area Chart Wizard:
-
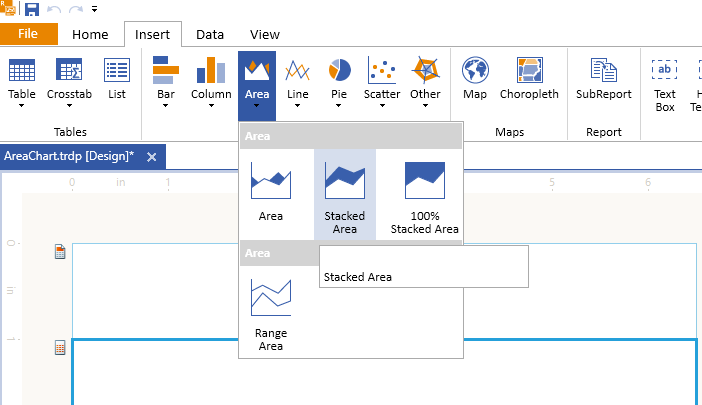
Add a Stacked Area chart:
-
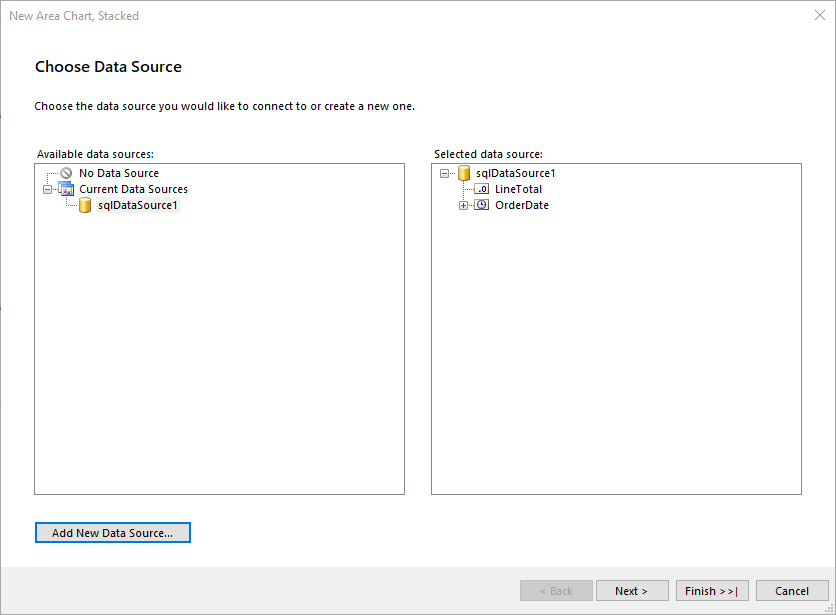
Select the SqlDataSource, or create it with the Add New Data Source... button and by using the query above:
-
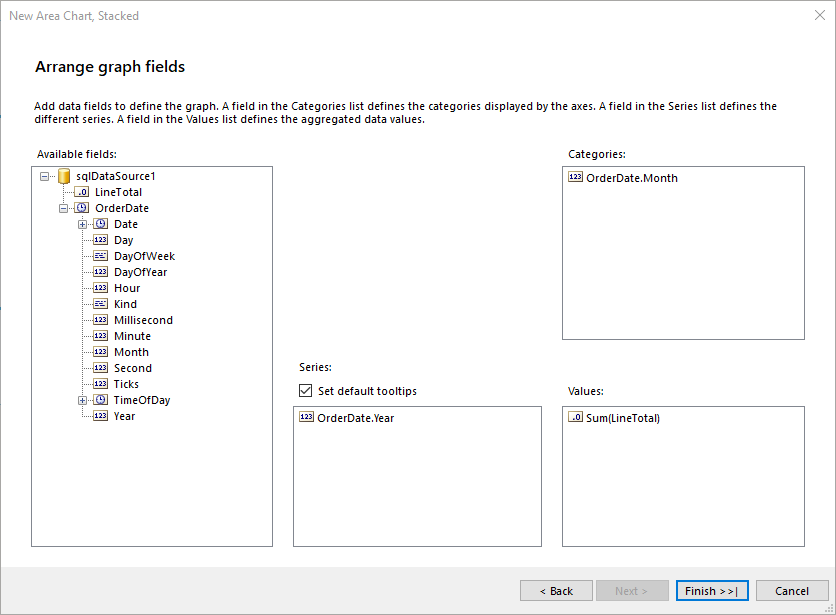
Arrange the Area Chart:
- Drag the OrderDate.Month field to Categories.
- Drag the OrderDate.Year field to the Series.
- Drag the LineTotal field to the Values. The wizard will automatically apply the
Sumaggregate function.
-
The
LineTotalvalue is large, so let's change theData > Yexpression ofareaSeriesthat is currently=Sum(Fields.LineTotal)to=ISNULL(Sum(Fields.LineTotal), 0) / 1000.0. Note that aNullcheck is also included and theNullvalues to be replaced with a0(zero). -
Set the Graph Category's
Labelto= Format("{0:MMM}", Fields.OrderDate). This action will force the Category labels that are months in this example to be displayed with the abbreviations of the month names rather than the default month number.
To see the full implementation of the sample report, refer to the AreaChart.trdp project on GitHub.
Creating Area Charts Manually
This section will show how to manually create a Stacked Area chart.
1. Add the Graph
To add a new Graph report item to the report, refer to the article on getting started with the Graph report item.
2. Set the SeriesGroups Hierarchy
Now you can set the SeriesGropus hierarchy of the Stacked Area chart:
- Open the SeriesGroups collection editor and click Add.
- Set the Groupings to
=Fields.OrderDate.Year. - Set the Sortings to
=Fields.OrderDate.Year. - Set the Name to
seriesGroup1.
3. Set the CategoryGroups Hierarchy
Next, you will have to define the CategoryGroups hierarchy of the Stacked Area chart:
- Open the CategoryGroups collection editor and click Add.
- Set the Groupings to
=Fields.OrderDate.Month. - Set the Sortings to
=Fields.OrderDate.Month. - Set the Name to
categoryGroup1.
4. Configure the Coordinate System
Here you will specify the coordinate system details:
- Open the CoordinateSystems collection editor and Add a new CartesianCoordinateSystem.
- Leave the Name to
cartesianCoordinateSystem1. - Set the XAxis to New Axis with Category Scale.
- Set the YAxis to New Axis with Numerical Scale.
5. Configure the Series
In this step, you will configure the series of the chart:
- Open the Series collection editor and Add new AreaSeries.
- Set the CategoryGroup to categoryGroup1.
- Set the SeriesGroup to seriesGroup1.
- Set the CoordinateSystem to cartesianCoordinateSystem1.
- Set the ArrangeMode to Stacked.
- Set the Y value to
=ISNULL(Sum(Fields.LineTotal), 0) / 1000.0.
6. Style the Appearance
To set the color palette, format the labels, define the values of the legend, and elaborate on any other styling options, refer to the section on formatting the Graph.