Creating and Customizing Bar Charts
A bar chart displays data series as sets of horizontal bars. In Telerik Reporting, use a bar chart when you need to compare values across categories and the category labels need more horizontal space.
Bar charts work well for category comparisons, rankings, and time-based summaries. If the same data reads better with vertical bars, use Column Charts instead.
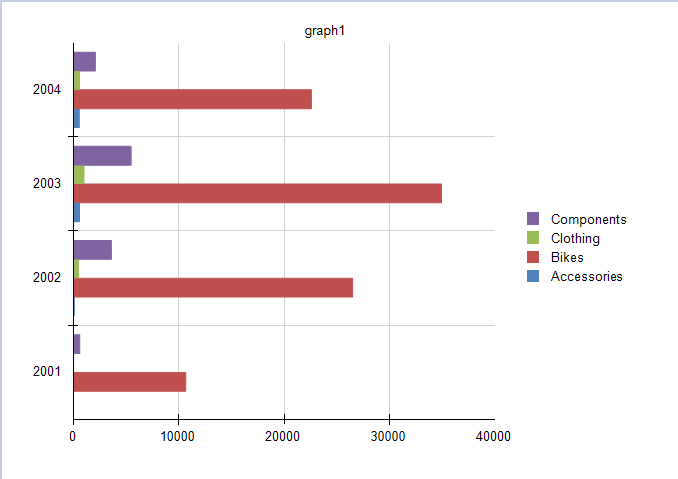
The following preview shows a clustered bar chart built from product category sales by year:
When to Use a Bar Chart
Use a bar chart when you need to:
- Compare values across categories.
- Display long category names that would be hard to read on a column chart.
- Compare multiple series that share the same set of categories.
- Emphasize ranking or magnitude from left to right.
Types
The Graph item supports the following bar chart types:
| Type | Use it when | Result |
|---|---|---|
| Clustered Bar | You want to compare individual values across categories | Each series is displayed as a separate horizontal bar |
| Stacked Bar | You want to compare both totals and each series contribution | Each category shows one stacked horizontal bar |
| 100% Stacked Bar | You want to compare percentage distribution across categories | Each category fills 100% of the available bar length |
If you only need one series, a stacked bar chart looks the same as a standard bar chart. Choose a stacked variation only when the contribution of each series matters.
Creating Bar Charts with the Bar Chart Wizard
This walkthrough creates a clustered bar chart that plots LineTotal by Category and OrderDate.Year. The same field mapping also works for stacked and 100% stacked bar charts.
Before You Start
Before you run the wizard, make sure that:
- You have a report open in a Telerik Report Designer.
- Your data source returns
Category,OrderDate.Year, andLineTotal. - You know whether you want raw totals or values scaled to thousands for readability.
The sample report uses a predefined SqlDataSource that connects to the AdventureWorks sample database. The query that returns the required fields is:
SELECT
    [Production].[ProductCategory].[Name] AS [Category],
    [Sales].[SalesOrderHeader].[OrderDate],
    [Sales].[SalesOrderDetail].[LineTotal]
FROM
    [Production].[Product] INNER JOIN
    [Production].[ProductSubcategory] ON [Production].[Product].[ProductSubcategoryID] = [Production].[ProductSubcategory].[ProductSubcategoryID] INNER JOIN
    [Production].[ProductCategory] ON [Production].[ProductSubcategory].[ProductCategoryID] = [Production].[ProductCategory].[ProductCategoryID] INNER JOIN
    [Sales].[SalesOrderDetail] ON [Production].[Product].[ProductID] = [Sales].[SalesOrderDetail].[ProductID] INNER JOIN
    [Sales].[SalesOrderHeader] ON [Sales].[SalesOrderDetail].[SalesOrderID] = [Sales].[SalesOrderHeader].[SalesOrderID]
Create the Chart
To create the bar chart by using the Bar Chart Wizard:
-
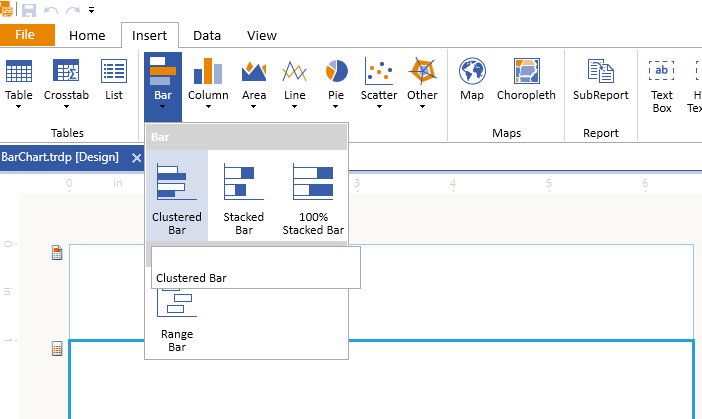
In the designer, add a Clustered Bar Chart.
-
Select the existing
SqlDataSource, or click Add New Data Source... and create one by using the query above.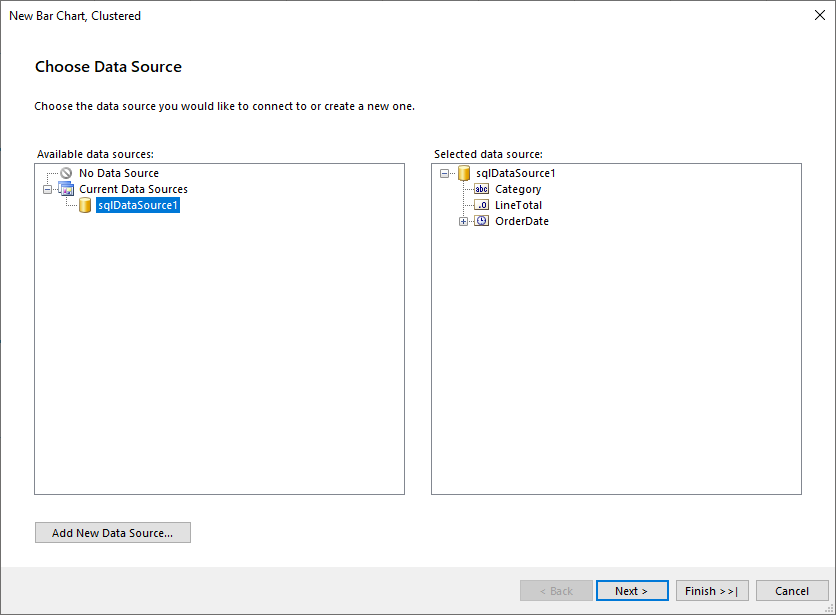
-
Drag
Categoryto Series. -
Drag
OrderDate.Yearto Categories. -
Drag
LineTotalto Values. The wizard automatically applies theSumaggregate function.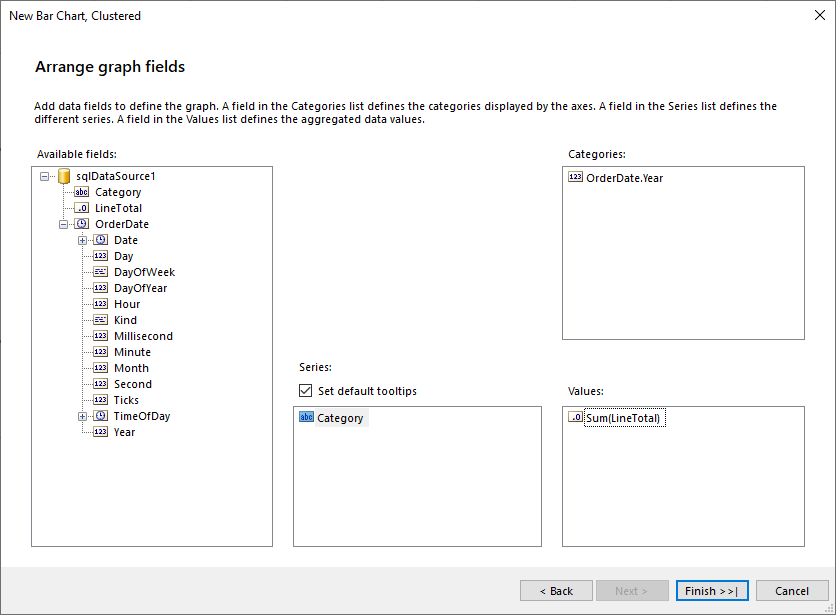
-
Finish the wizard and preview the chart.
-
If you want the value axis to display totals in thousands, select
barSeriesand changeData > Xfrom=Sum(Fields.LineTotal)to=ISNULL(Sum(Fields.LineTotal), 0) / 1000.0.
This configuration creates one series per product category and one category group per year. Because bar charts use horizontal bars, the numerical value is plotted on the X axis.
If you want a stacked or 100% stacked bar chart, choose that chart type in the first wizard step. The data source and field mapping steps stay the same.
To see the full implementation of the sample report, refer to the BarChart.trdp project on GitHub.
Creating Bar Charts Manually
Manual setup is useful when you want full control over the group hierarchy, coordinate system, and series properties.
1. Add the Graph
To add a new Graph report item to the report, refer to Getting Started with the Graph Report Item.
2. Set the SeriesGroups Hierarchy
Use the SeriesGroups hierarchy to split the chart into separate series for each product category:
- Open the
SeriesGroupscollection editor and click Add. - Set
Groupingsto=Fields.Category. - Set
Sortingsto=Fields.Category. - Set
NametoseriesGroup1.
If you want the output to match a filtered sample, add a group filter that excludes the category you do not want to display.
3. Set the CategoryGroups Hierarchy
Use the CategoryGroups hierarchy to create one group for each year:
- Open the
CategoryGroupscollection editor and click Add. - Set
Groupingsto=Fields.OrderDate.Year. - Set
Sortingsto=Fields.OrderDate.Year. - Set
NametocategoryGroup1.
4. Configure the Coordinate System
Bar charts use a numerical X axis and a categorical Y axis because the bars are horizontal:
- Open the
CoordinateSystemscollection editor and click Add to create a newCartesianCoordinateSystem. - Leave
Nameset tocartesianCoordinateSystem1. - Set
XAxisto New Axis with Numerical Scale. - Set
YAxisto New Axis with Category Scale.
5. Configure the Series
Add a BarSeries that uses the group hierarchy and coordinate system you just defined:
- Open the
Seriescollection editor and click Add to create a newBarSeries. - Set
CategoryGrouptocategoryGroup1. - Set
SeriesGrouptoseriesGroup1. - Set
CoordinateSystemtocartesianCoordinateSystem1. - Set
ArrangeModetoClustered. - Set
Xto=ISNULL(Sum(Fields.LineTotal), 0) / 1000.0.
6. Style the Appearance
To set the color palette, format the labels, define the legend values, and configure other styling options, refer to Formatting the Graph.
Design Considerations
Keep the following design considerations in mind:
- Bar charts reverse the usual chart axes. The category axis is the vertical Y axis, and the value axis is the horizontal X axis.
- Use a bar chart when category labels are long and would be hard to read on a column chart.
- If your chart contains more than three series, consider a stacked bar chart to reduce visual clutter.
- By default, data point labels are placed at the outside end of each bar. If labels overlap the bars, change DataPointLabelAlignment in the Properties window.
- If the bars become too thin, increase
SpacingSlotCounton the category axis scale to reserve more space between bars.