.NET MAUI Chart Legend
The Legend feature of the RadChart provide description about the series which are visualized within the control.
1. Initialize a new object of type RadLegend.
<telerik:RadPieChart x:Name="pieChart" HeightRequest="300">
    <telerik:RadCartesianChart.BindingContext>
        <local:ViewModel />
    </telerik:RadCartesianChart.BindingContext>
    <telerik:RadPieChart.Series>
        <telerik:PieSeries DisplayName="Value" LegendTitleBinding="Category" ItemsSource="{Binding Data1}" ValueBinding="Value"/>
    </telerik:RadPieChart.Series>
</telerik:RadPieChart>
<telerik:RadLegend HeightRequest="200"
                   LegendItemFontColor="DarkGreen"
                   LegendItemFontSize="20"
                   LegendProvider="{x:Reference Name=pieChart}"/>
2. Add the ViewModel:
public class ViewModel
{
    public ViewModel()
    {
        this.Data1 = GetCategoricalData();
        this.Data2 = GetCategoricalData2();
        this.Data3 = GetCategoricalData3();
    }

    public ObservableCollection<CategoricalData> Data1 { get; set; }

    public ObservableCollection<CategoricalData> Data2 { get; set; }

    public ObservableCollection<CategoricalData> Data3 { get; set; }

    private static ObservableCollection<CategoricalData> GetCategoricalData()
    {
        var data = new ObservableCollection<CategoricalData>  {
            new CategoricalData { Category = "A", Value = 0.63 },
            new CategoricalData { Category = "B", Value = 0.85 },
            new CategoricalData { Category = "C", Value = 1.05 },
            new CategoricalData { Category = "D", Value = 0.96 },
            new CategoricalData { Category = "E", Value = 0.78 },
        };

        return data;
    }

    private static ObservableCollection<CategoricalData> GetCategoricalData2()
    {
        var data = new ObservableCollection<CategoricalData>  {
            new CategoricalData { Category = "A", Value = 0.13 },
            new CategoricalData { Category = "B", Value = 0.35 },
            new CategoricalData { Category = "C", Value = 0.55 },
            new CategoricalData { Category = "D", Value = 0.46 },
            new CategoricalData { Category = "E", Value = 0.28 },
        };

        return data;
    }

    private static ObservableCollection<CategoricalData> GetCategoricalData3()
    {
        var data = new ObservableCollection<CategoricalData>  {
            new CategoricalData { Category = "A", Value = 1.63 },
            new CategoricalData { Category = "B", Value = 1.85 },
            new CategoricalData { Category = "C", Value = 2.05 },
            new CategoricalData { Category = "D", Value = 1.96 },
            new CategoricalData { Category = "E", Value = 1.78 },
        };

        return data;
    }
}
The following image shows the RadLegend in combination with the Pie Chart.
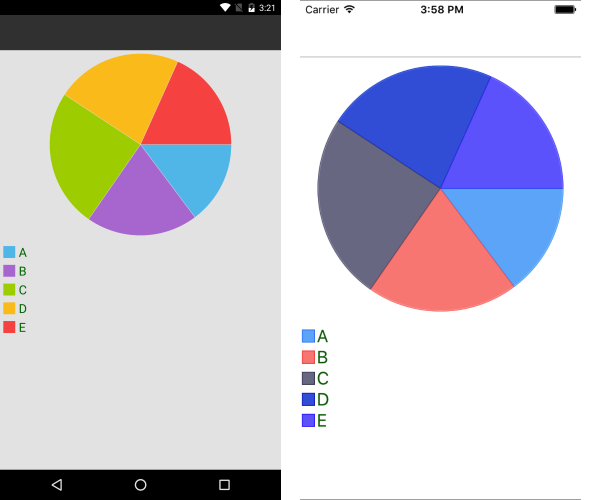
Properties
As shown in the previous image, each item within the RadLegend represents a specific series. The most important property which you need to set is the LegendProvider. It will point to the chart object whose series will be included in the legend.
The following list summarizes the most important properties of the RadLegend control. In brackets is commented the type of the property:
LegendProvider(RadChartBase)—The Chart control whose series will be described in the legend.LegendItemFontSize(double)—The size of the item's title text.LegendItemFontColor(Color)—The color of the item's title text.LegendItemIconSize(Size)—The size of the title icons.Orientation(LegndOrientation)—Sets the orientation of the legend. Can beHorizontalorVertical.
RadLegend can be used in combination with RadCartesianChart as well.
The following example demonstrates how to define some of the most important Chart legend properties.
1. Define the RadLegend in XAML:
<telerik:RadCartesianChart x:Name="chart" HeightRequest="300">
    <telerik:RadCartesianChart.BindingContext>
        <local:ViewModel />
    </telerik:RadCartesianChart.BindingContext>
    <telerik:RadCartesianChart.HorizontalAxis>
        <telerik:CategoricalAxis />
    </telerik:RadCartesianChart.HorizontalAxis>
    <telerik:RadCartesianChart.VerticalAxis>
        <telerik:NumericalAxis />
    </telerik:RadCartesianChart.VerticalAxis>
    <telerik:RadCartesianChart.Series>
        <telerik:LineSeries CategoryBinding="Category"
                            ValueBinding="Value"
                            DisplayName=" Data1"
                            ItemsSource="{Binding Data1}" />
        <telerik:LineSeries CategoryBinding="Category"
                            ValueBinding="Value"
                            DisplayName=" Data2"
                            ItemsSource="{Binding Data2}" />
        <telerik:LineSeries CategoryBinding="Category"
                            ValueBinding="Value"
                            DisplayName=" Data3"
                            ItemsSource="{Binding Data3}" />
    </telerik:RadCartesianChart.Series>
</telerik:RadCartesianChart>
<telerik:RadLegend LegendProvider="{x:Reference Name=chart}"
                   LegendItemFontColor="DarkGreen"
                   HeightRequest="200"/>
2. Define the ViewModel:
public class ViewModel
{
    public ViewModel()
    {
        this.Data1 = GetCategoricalData();
        this.Data2 = GetCategoricalData2();
        this.Data3 = GetCategoricalData3();
    }

    public ObservableCollection<CategoricalData> Data1 { get; set; }

    public ObservableCollection<CategoricalData> Data2 { get; set; }

    public ObservableCollection<CategoricalData> Data3 { get; set; }

    private static ObservableCollection<CategoricalData> GetCategoricalData()
    {
        var data = new ObservableCollection<CategoricalData>  {
            new CategoricalData { Category = "A", Value = 0.63 },
            new CategoricalData { Category = "B", Value = 0.85 },
            new CategoricalData { Category = "C", Value = 1.05 },
            new CategoricalData { Category = "D", Value = 0.96 },
            new CategoricalData { Category = "E", Value = 0.78 },
        };

        return data;
    }

    private static ObservableCollection<CategoricalData> GetCategoricalData2()
    {
        var data = new ObservableCollection<CategoricalData>  {
            new CategoricalData { Category = "A", Value = 0.13 },
            new CategoricalData { Category = "B", Value = 0.35 },
            new CategoricalData { Category = "C", Value = 0.55 },
            new CategoricalData { Category = "D", Value = 0.46 },
            new CategoricalData { Category = "E", Value = 0.28 },
        };

        return data;
    }

    private static ObservableCollection<CategoricalData> GetCategoricalData3()
    {
        var data = new ObservableCollection<CategoricalData>  {
            new CategoricalData { Category = "A", Value = 1.63 },
            new CategoricalData { Category = "B", Value = 1.85 },
            new CategoricalData { Category = "C", Value = 2.05 },
            new CategoricalData { Category = "D", Value = 1.96 },
            new CategoricalData { Category = "E", Value = 1.78 },
        };

        return data;
    }
}
The following image shows the RadLegend control in combination with a Cartesian Chart.
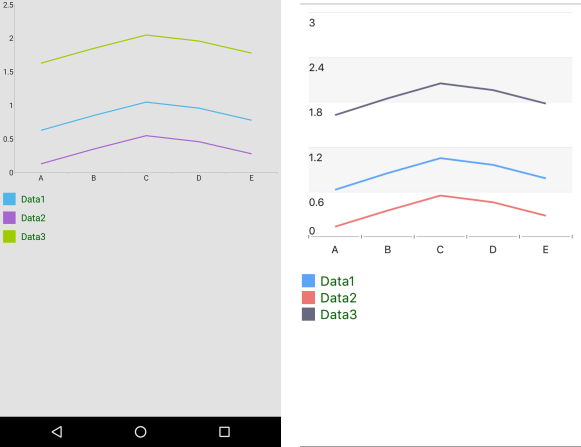
Legend Title Binding
The LegendTitleBinding is a property which can be set for the Pie Series. It points to the property of the data item which will be used as a title in the legend. For all other series, the DisplayName property will be used instead.
<telerik:RadPieChart.Series>
    <telerik:PieSeries DisplayName="Value" LegendTitleBinding="Category" ItemsSource="{Binding Data1}" ValueBinding="Value"/>
</telerik:RadPieChart.Series>