.NET MAUI Chart Annotations
Annotations are visual elements that are used to highlight areas on the plot. They can be displayed as comments or as markers for specific values on the plot. You can use any visual element as a template for the annotation.
The Chart supports the following types of annotations:
CartesianGridLineAnnotation—This annotation is visually represented by straight lines across the chart that mark specific values on the associated Cartesian axis.CartesianPlotBandAnnotation—This annotation is visually represented by a band across the chart that marks a specific range on the associated Cartesian axis.
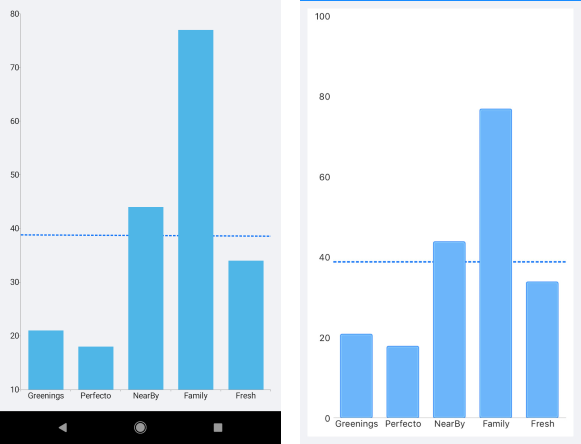
CartesianGridLineAnnotation
The CartesianGridLineAnnotation represents a vertical or horizontal line that crosses the entire plot area and provides the following features:
Axis—TheCartesianGridLineAnnotationhas to be explicitly associated with a horizontal or a vertical cartesian axis.Value—The place on the associated axis where a line crosses it.
When the associated axis is numerical, the
CartesianGridLineAnnotationexpects a numeric value. When the associated axis is a Categorical Axis, theCartesianGridLineAnnotationexpects a category.
The following example shows how the CartesianGridLineAnnotation works:
1. Create the needed business objects:
public class CategoricalData
{
    public object Category { get; set; }
    public double Value { get; set; }
}
2. Create a ViewModel:
public class ViewModel
{
    public ObservableCollection<CategoricalData> Data { get; set; }
    public double Threshold { get; set; }

    public ViewModel()
    {
        this.Data = GetCategoricalData();
        this.Threshold = this.Data.Average(data => data.Value);
    }

    private static ObservableCollection<CategoricalData> GetCategoricalData()
    {
        var data = new ObservableCollection<CategoricalData>
        {
            new CategoricalData { Category = "Greenings", Value = 21 },
            new CategoricalData { Category = "Perfecto", Value = 18 },
            new CategoricalData { Category = "NearBy", Value = 44 },
            new CategoricalData { Category = "Family", Value = 77 },
            new CategoricalData { Category = "Fresh", Value = 34 },
        };
        return data;
    }
}
3. Declare the RadChart in XAML:
<telerik:RadCartesianChart>
    <telerik:RadCartesianChart.BindingContext>
        <local:ViewModel />
    </telerik:RadCartesianChart.BindingContext>
    <telerik:RadCartesianChart.HorizontalAxis>
        <telerik:CategoricalAxis LabelFitMode="MultiLine" />
    </telerik:RadCartesianChart.HorizontalAxis>
    <telerik:RadCartesianChart.VerticalAxis>
        <telerik:NumericalAxis x:Name="verticalAxis" />
    </telerik:RadCartesianChart.VerticalAxis>
    <telerik:RadCartesianChart.Series>
        <telerik:BarSeries ValueBinding="Value"
                                CategoryBinding="Category"
                                ItemsSource="{Binding Data}" />
    </telerik:RadCartesianChart.Series>
    <telerik:RadCartesianChart.Annotations>
        <telerik:CartesianGridLineAnnotation Stroke="#0E72F6"
                                                  StrokeThickness="2"
                                                  Axis="{x:Reference verticalAxis}"
                                                  Value="{Binding Threshold}">
            <telerik:CartesianGridLineAnnotation.DashArray>
                <x:Array Type="{x:Type x:Double}">
                    <x:Double>4.0</x:Double>
                    <x:Double>2.0</x:Double>
                </x:Array>
            </telerik:CartesianGridLineAnnotation.DashArray>
        </telerik:CartesianGridLineAnnotation>
    </telerik:RadCartesianChart.Annotations>
</telerik:RadCartesianChart>
The following image shows how the CartesianGridLineAnnotation looks:
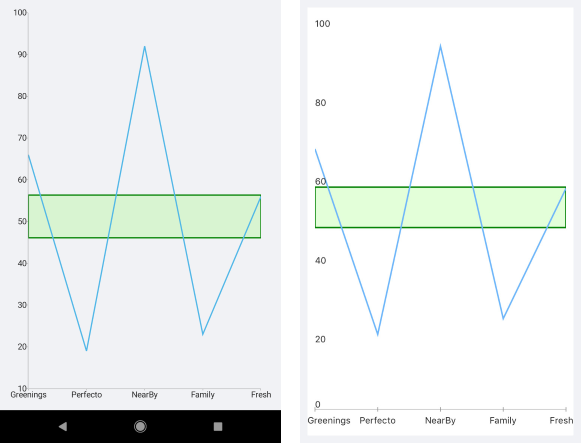
CartesianPlotBandAnnotation
The CartesianPlotBandAnnotation represents a vertical or horizontal area that crosses the entire plot area and provides the following features:
Axis—TheCartesianPlotBandAnnotationneeds to be explicitly associated with a horizontal or a vertical axis.From—The starting value for the plot band.To—The ending value for the plot band.Fill—Gets or sets the Fill.
The following example shows how the CartesianPlotBandAnnotation works:
1. Create the needed business objects:
public class CategoricalData
{
    public object Category { get; set; }
    public double Value { get; set; }
}
2. Define the ViewModel:
public class ViewModel
{
    public ObservableCollection<CategoricalData> Data { get; set; }
    public double StartThreshold { get; private set; }
    public double EndThreshold { get; private set; }

    public ViewModel()
    {
        this.Data = GetCategoricalData();
        var threshold = this.Data.Average(data => data.Value);
        this.StartThreshold = threshold * 0.9;
        this.EndThreshold = threshold * 1.1;
    }

    private static ObservableCollection<CategoricalData> GetCategoricalData()
    {
        var data = new ObservableCollection<CategoricalData>
        {
            new CategoricalData { Category = "Greenings", Value = 66 },
            new CategoricalData { Category = "Perfecto", Value = 19 },
            new CategoricalData { Category = "NearBy", Value = 92 },
            new CategoricalData { Category = "Family", Value = 23 },
            new CategoricalData { Category = "Fresh", Value = 56 },
        };
        return data;
    }
}
3. Declare the RadChart control in XAML:
<telerik:RadCartesianChart>
    <telerik:RadCartesianChart.BindingContext>
        <local:ViewModel />
    </telerik:RadCartesianChart.BindingContext>
    <telerik:RadCartesianChart.HorizontalAxis>
        <telerik:CategoricalAxis LabelFitMode="MultiLine"
                                      PlotMode="OnTicks" />
    </telerik:RadCartesianChart.HorizontalAxis>
    <telerik:RadCartesianChart.VerticalAxis>
        <telerik:NumericalAxis x:Name="verticalAxis" />
    </telerik:RadCartesianChart.VerticalAxis>
    <telerik:RadCartesianChart.Series>
        <telerik:LineSeries ValueBinding="Value"
                                 CategoryBinding="Category"
                                 ItemsSource="{Binding Data}" />
    </telerik:RadCartesianChart.Series>
    <telerik:RadCartesianChart.Annotations>
        <telerik:CartesianPlotBandAnnotation StrokeThickness="2"
                                                  Stroke="Green"
                                                  Fill="#2F66FF33"
                                                  Axis="{x:Reference verticalAxis}"
                                                  From="{Binding StartThreshold}"
                                                  To="{Binding EndThreshold}" />
    </telerik:RadCartesianChart.Annotations>
</telerik:RadCartesianChart>
The following image shows how the CartesianPlotBandAnnotation looks: