
Hi everyone
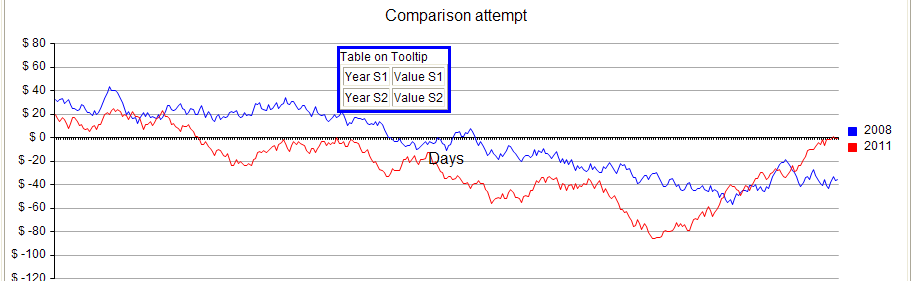
I have a chart with to line series (Image), with the OnClientSeriesHovered and a JS function I achieve the information of both series show and update on the table aside, but My boss want to put that table in the Tooltip:
With this code (C#), I achive this Image2:
I try to change something like this:
and whith Javascript try to change the value with:
But the "
In the help Page ClientTemplate for Series Labels and Tooltips, explain how to define a Tooltip format, with a DataSource/DataBind option, so I think I may try to use this making two DataTable:
DT1: (Value_Series1, Day, Value_Series1, Value_Series_2)
DT2: (Value_Series2, Day, Value_Series1, Value_Series_2)
and in the code put somthing like this:
But I don't find the way to binding two DataTables, and if this will work.
Any advice?, please!
I have a chart with to line series (Image), with the OnClientSeriesHovered and a JS function I achieve the information of both series show and update on the table aside, but My boss want to put that table in the Tooltip:
With this code (C#), I achive this Image2:
series3.TooltipsAppearance.ClientTemplate = "Table on Tooltip
<table border=\"1\"><tr><td>Year S1</td><td>Value S1</td></tr>
<tr><td>Year S2</td><td>Value S2</td></tr></table>";I try to change something like this:
<td id="R1">Year S1</td>and whith Javascript try to change the value with:
document.getElementById('R1').innerHTML = "(value)";But the "
document.getElementById('R1')" return "NULL"In the help Page ClientTemplate for Series Labels and Tooltips, explain how to define a Tooltip format, with a DataSource/DataBind option, so I think I may try to use this making two DataTable:
DT1: (Value_Series1, Day, Value_Series1, Value_Series_2)
DT2: (Value_Series2, Day, Value_Series1, Value_Series_2)
and in the code put somthing like this:
Day: #=dataItem.Day#

<table border=\"1\">

<tr><td>Year 1</td><td>#=dataItem.Value_Series1#</td></tr>

<tr><td>Year 2</td><td>#=dataItem.Value_Series2#</td></tr>

</table>
But I don't find the way to binding two DataTables, and if this will work.
Any advice?, please!

