Telerik Forums
UI for Blazor Forum
0 answers
143 views

In a TelerikSplitter when I click a button that causes data to load, every element at that level and lower gets the attribute tabindex="-1" for a split second and then the property is removed. Is there any function of the Splitter or Loader/LoaderContainer that would do this? This causes explicitly set tabindex attributes to be completely removed.

Update/Solution: 

I determined that this was the result of an intermediate Blazor component calling some JavaScript to disable tabbing on load. This issue is unrelated to the Telerik LoaderContainer.

David
Top achievements
Rank 1
 updated question on 23 Oct 2023
1 answer
759 views

Hi,

I want to disable and hide the marked part of the PDFViewer component.


How can i do that?

Thanks,

Ben

Hristian Stefanov
Telerik team
 answered on 23 Oct 2023
1 answer
174 views

Hi

Are there any options to customise ChartSeries visuals beyond colour? Our use-case involves charts rendered with series from multiple sources. We would like to differentiate the sources at a glance. We would prefer not to add more text-based labels. 

Things we have tried:

  1. ChartSeriesOverlay does not create much visual impact for our colour scheme.
  2. linear-gradient etc in the Colour parameter causes a black coloured series
  3. SVG patterns see REPL

Thank you

Mark

Svetoslav Dimitrov
Telerik team
 answered on 23 Oct 2023
1 answer
324 views

Hi,

I would like to create a Histogram Chart with components for Blazor like illustrated below :


Then Stacked like that as next step 

I tried Column Chart but I do not find a way to stick the graduation with the start and end of every bar like it was possible with wpf : 
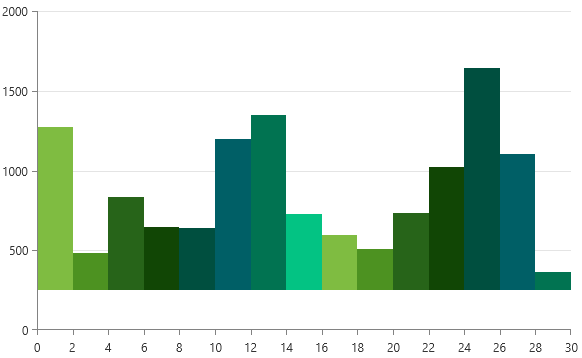
WPF ChartView - Histogram - Telerik UI for WPF

Thanks

Mark
Top achievements
Rank 3
Iron
Iron
Iron
 answered on 20 Oct 2023
0 answers
254 views

Hi

Can you add target markers to a column ChartSeries? Something a bit like this:

Bar Chart Target Markers - Excel University

Thanks

Mark

Mark
Top achievements
Rank 3
Iron
Iron
Iron
 asked on 20 Oct 2023
1 answer
258 views
I have a problem in the Grid, I have created a calculated field that for the example is the calculated date, this field does not belong to the TelerikGrid Data model, when clicking on the column header of said field an error occurs. It is very necessary to perform calculations and display them in a column, the data in my project is generated from a dbcontext, so I do not want to alter the SQL tables that I have been managing. There is a way to avoid this error, the error occurs even when removing the filter from the column, please, if someone has a solution it would help me out of trouble.

https://blazorrepl.telerik.com/GRPYFhvp14M25Tft34


@page "/Grid"

@using Telerik.Blazor.Services
@using Telerik.FontIcons;
@using Telerik.Blazor.Components.Grid

<TelerikGrid Data="@GridData" Height="550px" FilterMode="@GridFilterMode.FilterMenu"
                         Sortable="true" Pageable="true" PageSize="20" Groupable="true" Resizable="true" Reorderable="true">
    <GridColumns>
        <GridColumn Field="@nameof(Product.Name)" Title="Name"/>
        <GridColumn Field="@nameof(Product.Price)" DisplayFormat="{0:C2}" />
        <GridColumn Field="@nameof(Product.Released)" DisplayFormat="{0:D}" />
        <GridColumn Field="@nameof(Product.Discontinued)" />
        <GridColumn Field="Date Calculated (NO PRESENT IN MODEL)" Width="220px" DisplayFormat="{0:dddd, dd MMM yyyy}">
                        <Template>
                            @{
                                var fecha = (Product)context;
                                double FechaCalculada;
                                TimeSpan diferencia = DateTime.Today - fecha.Released;
                                double difDouble = 5+diferencia.TotalDays / 365.25; // considerando años bisiestos
                                FechaCalculada = Math.Round(difDouble, 2);
                            }
                            <TelerikNumericTextBox Decimals="2" @bind-Value=@FechaCalculada DebounceDelay="200" Enabled=false Arrows="false" />
                        </Template>
                    </GridColumn>
    </GridColumns>                    
</TelerikGrid>


@code {
    private List<Product> GridData { get; set; }

    protected override void OnInitialized()
    {
        GridData = new List<Product>();

        var rnd = new Random();

        for (int i = 1; i <= 30; i++)
        {
            GridData.Add(new Product
                {
                    Id = i,
                    Name = "Product name " + i,
                    Price = (decimal)(rnd.Next(1, 50) * 3.14),
                    Released = DateTime.Now.AddDays(-rnd.Next(1, 365)).AddYears(-rnd.Next(1, 10)).Date,
                    Discontinued = i % 5 == 0
                });

        }
    }

    public class Product
    {
        public int Id { get; set; }
        public string Name { get; set; }
        public decimal Price { get; set; }
        public DateTime Released { get; set; }
        public bool Discontinued { get; set; }
    }
}


Kind regards.


Hristian Stefanov
Telerik team
 answered on 20 Oct 2023
1 answer
264 views

I have a main grid that has 4 rows.

The top 3 rows have numeric data and formatted as: $0,00.00 etc.

The 4th row has percentage data in the cells. should be formatted as 0.00% or just 0.00.

Currently the data is showing up as $0.00

I am not sure how one would do that.

Any pointers?


Georgi
Telerik team
 answered on 19 Oct 2023
1 answer
374 views
Checkbox shows default tabindex="-1" but would like for users to be able to tab through grid
Dimo
Telerik team
 answered on 19 Oct 2023
1 answer
279 views

Ok I have a grid with many pages and a total of say 1million plus rows!

User filters this grid down to say 7000 rows.

When I click the export all button it will export the rows they filtered. Alls good.

But when they export the whole dataset I have to intercept that to do the export myself and email them a link to it.

My issue is I cant seem to find a way to figure out how many rows are in the filtered version.

So currently I have: ( in the async Task gridRpt_OnBeforeExcelExport(GridBeforeExcelExportEventArgs args) )

If the grid.count > 1000000

then go do my email export procedure

ELSE do the grids default export.

Problem is when the grid is filtered That grid.count is still the big dataset count not the filtered count.

How do I know the filtered count and if that filtered count is still over 1mil how to I export only that filtered set?


Hope that makes sense.

Thanks

Deasun.


Dimo
Telerik team
 answered on 19 Oct 2023
1 answer
208 views

With ChartCategoryAxes, is it possible to label the group and then each column within it? For example, https://blazorrepl.telerik.com/QdbaPgbU17q4epgO21:

  1. We have tried to use ChartCategoryAxisLabel templates. But without HTML to enable styling it is difficult to space the elements evenly.
  2. We have tried adding an invisible series at the top of the stacked series with a label, but on dark backgrounds the invisible series is revealed on hover. We can use brittle CSS selectors to hide the hover but ideally our label would be beneath the chart, within the axis. 


Dimo
Telerik team
 answered on 19 Oct 2023
Narrow your results
Selected tags
Tags
+? more
Top users last month
Simon
Top achievements
Rank 2
Iron
Iron
Bob
Top achievements
Rank 3
Iron
Iron
Veteran
Marco
Top achievements
Rank 4
Iron
Iron
Iron
Grant
Top achievements
Rank 3
Iron
Iron
Iron
Kao Hung
Top achievements
Rank 1
Iron
Want to show your ninja superpower to fellow developers?
Top users last month
Simon
Top achievements
Rank 2
Iron
Iron
Bob
Top achievements
Rank 3
Iron
Iron
Veteran
Marco
Top achievements
Rank 4
Iron
Iron
Iron
Grant
Top achievements
Rank 3
Iron
Iron
Iron
Kao Hung
Top achievements
Rank 1
Iron
Want to show your ninja superpower to fellow developers?