or
5 answers
166 views
HI all,
Im trying to change the maxvalue from a radnumericbox from codebehind.
the value changes depending the value of od a radcombobox, i having problem with that tried in selectindexchange and even on the radnumeric onload but nothing works any opinions how i can do this , from code behind.
Best Regards

Konstantin Dikov
Telerik team

answered
on
31 Jan 2017
2 answers
400 views
Hi,
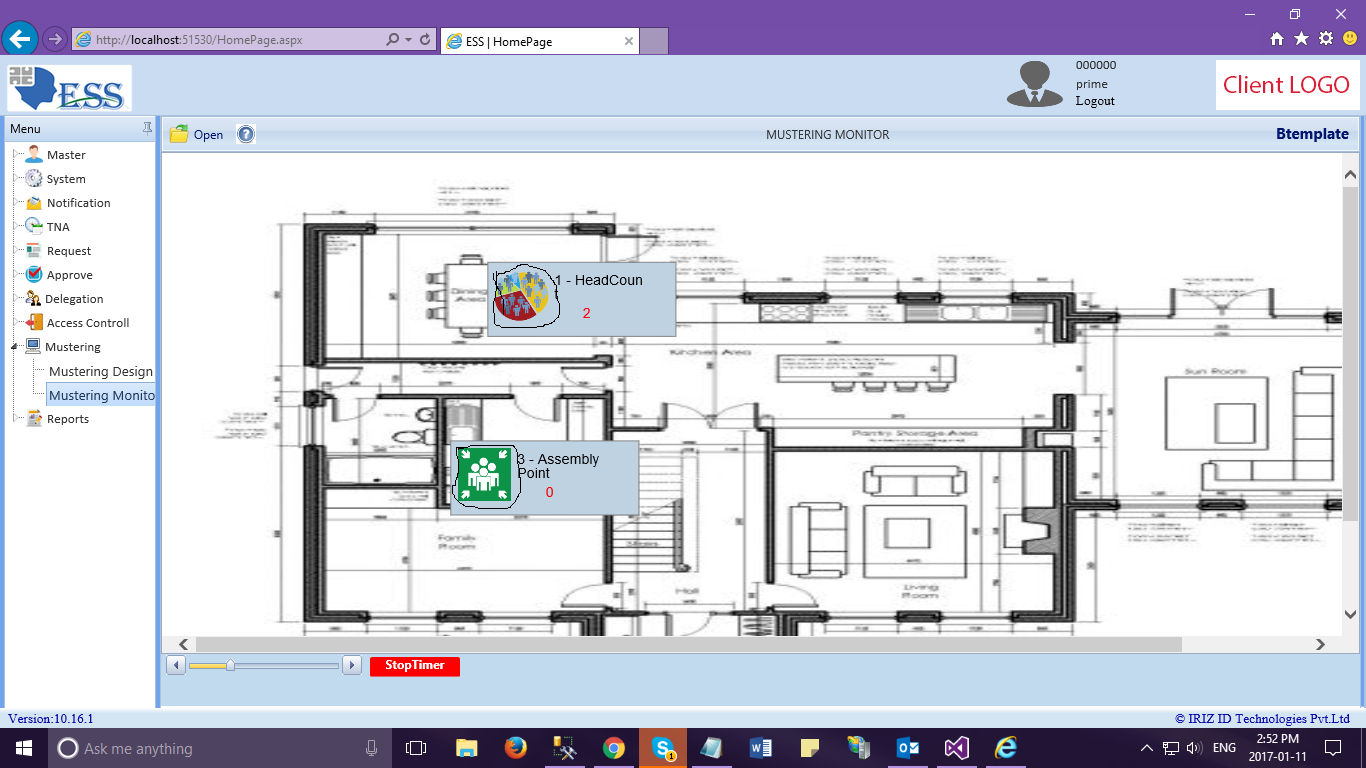
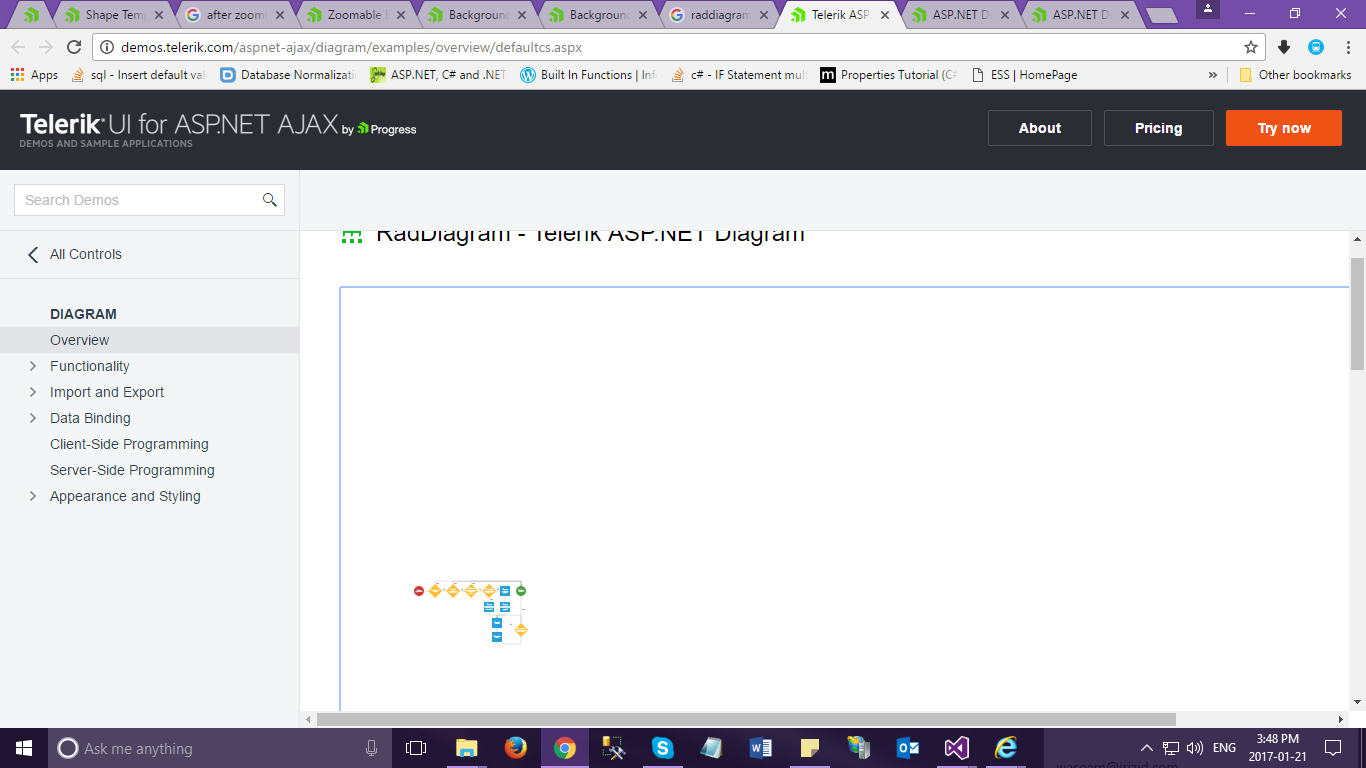
As we are working on RAD DIAGRAM and we are trying to customise. Our requirement is to show the designed diagram even after zoom in and zoom out but in the existing one once we zoom in and try to zoom out the designed diagram is going out of the RAD DIAGRAM window. So can you please suggest us to resolve this issue asap.
Thanks & Regards
Bhavya


1 answer
120 views
When I add a Group using RadFilter, even when I select another operator (such as 'Or', 'Not And' or 'Not Or'), the provider Result always shows 'And'. I have verified that the ExpressionItem is a GroupExpression, and its GroupOperator is 'Or' when that is selected. I can live with the display being in error, but I can't seem to access the GroupOperator = so that I can use it if that's the case. Please advise- is this a bug? Any actions or code to correct or at least access the values in the collection? I have attached a screen shot showing the issue.
Milena
Telerik team
answered
on
31 Jan 2017
1 answer
248 views
Hi,
I have discovered an issue where the SelectedItem for a RadComboBox is null.
I use a System.Collections.Generic.IList to populate the RadComboBox.
When the IList has more than one item, then the RadComboBox works fine, and I can get the SelectedItem.
When the IList only has one item, then the RadComboBox has a SelectedItem of null.
Please see the attached to see how I populate the RadComboBox
Kinds regards,
Rob

Ivan Danchev
Telerik team
answered
on
31 Jan 2017
1 answer
111 views
Hi,
I have downloaded the Telerik components recently, but no skin is available for ComboBox although they are available in the directory (C:\Program Files\Telerik\UI for ASP.NET AJAX R1 2017\Skins)
Regards,
Sara
Ivan Danchev
Telerik team
answered
on
31 Jan 2017
9 answers
1.1K+ views
I have few text boxes and one RadAsyncUpload in the form.
When the form is submitted i am validating the text boxes in the server side and showing the validation message.
when the validation message box is shown, The RadAsyncupload controls is getting cleared.
I want to have the radAsyncUpload Control values to be persisted for the subsequent submit.
Thanks
Ivan Danchev
Telerik team
answered
on
31 Jan 2017
0 answers
154 views
Hi,
I want to upgrade from RadChart to RadHtmlChart. I am using version 2014.2.724.
Below is my current code with RadChart:
<radc1:radchart id="chart1" Width="700px" Margins-Top="20%" Margins-Right="2%" Margins-Left="5%"
Margins-Bottom="20%" Runat="server" align="centre" TextQuality="ClearTypeGridFit" ImageQuality="AntiAlias">
<Appearance FillStyle-MainColor ="White" FillStyle-SecondColor="AliceBlue" Border-Color=""></Appearance>
<PlotArea Appearance-FillStyle-MainColor ="White" Appearance-Corners="Rectangle,Rectangle,Rectangle,Rectangle,6"
Appearance-FillStyle-SecondColor="White">
<XAxis
Appearance-TextAppearance-TextProperties-Font="Arial, 6pt" Appearance-LabelAppearance-RotationAngle ="340"
Appearance-MajorGridLines-Color ="DimGray" Appearance-MinorGridLines-Color ="DimGray"
Appearance-MinorGridLines-Visible ="false" Appearance-MajorGridLines-Visible ="false"
Appearance-MajorTick-Length=2 Appearance-MajorTick-Color ="#C9C9C7"></XAxis>
<YAxis Appearance-TextAppearance-TextProperties-Font ="Arial, 6pt" Appearance-Color="#C9C8C7" MaxValue="80"
MinValue="-100" MaxItemsCount="15" Step="20" Appearance-MajorGridLines-Color ="DimGray" Appearance-MajorGridLines-Visible ="true" Appearance-MinorGridLines-Visible ="true" Appearance-MajorTick-Color ="#C9C8C7" >
<AxisLabel Visible="True" TextBlock-Text ="Number of Cases" Appearance-Position-Auto="true" TextBlock-Appearance-TextProperties-Font ="Verdana, 11px" TextBlock-Appearance-TextProperties-Color ="Black">
</AxisLabel >
</YAxis>
</PlotArea>
<Legend Visible="False">
<Appearance FillStyle-MainColor ="White" FillStyle-FillType ="Solid" Border-Color="227, 227, 227"></Appearance>
</Legend>
<ChartTitle TextBlock-Text ="Outstanding Cases - Number" TextBlock-Appearance-TextProperties-Font ="Arial, 10pt, style=Bold" TextBlock-Appearance-TextProperties-Color="128, 128, 255"
TextBlock-Appearance-Position-AlignedPosition="center" >
<Appearance FillStyle-FillType ="Solid" FillStyle-MainColor ="White" Border-Color="White"></Appearance>
</ChartTitle>
</radc1:radchart>
I am binding the chart data at server side.
Please suggest
harshal
Top achievements
 Rank 1
asked
on
31 Jan 2017
36 answers
1.7K+ views
Hello,
I want to add "ALL" option to my RadGrid Page Size combo. I want the options 50,100,150,ALL. I know we can customize the page size option. However when I am adding the "ALL" option, it is returning an error "Input string was not in correct format". The requirement is when selecting the "ALL" option I want to show all the records in the Grid.
Please advise!
Thank you,
Asok
1 answer
107 views
We have an older version (2013.3.1010.45) of telerik and have recently started to see some errors with radchart. How do we handle this type of error and what is the cause of this error?
Exception of type 'System.Web.HttpUnhandledException' was thrown.
Image could not be created at System.Web.UI.Page.HandleError(Exception e)
at System.Web.UI.Page.ProcessRequestMain(Boolean includeStagesBeforeAsyncPoint, Boolean includeStagesAfterAsyncPoint)
at System.Web.UI.Page.ProcessRequest(Boolean includeStagesBeforeAsyncPoint, Boolean includeStagesAfterAsyncPoint)
at System.Web.UI.Page.ProcessRequest()
at System.Web.UI.Page.ProcessRequestWithNoAssert(HttpContext context)
at System.Web.UI.Page.ProcessRequest(HttpContext context)
at ASP.search_mydashboard2_aspx.ProcessRequest(HttpContext context)
at System.Web.HttpApplication.CallHandlerExecutionStep.System.Web.HttpApplication.IExecutionStep.Execute()
at System.Web.HttpApplication.ExecuteStep(IExecutionStep step, Boolean& completedSynchronously)
John
Top achievements
Rank 1
answered
on
30 Jan 2017
2 answers
218 views
I can't seem to figure out how to keep the "Remove" button on the same line as uploaded media file. When the file name is really short it stays on the same line but if the file name gets longer the "Remove" button drops down below. There is plenty of horizontal space for both to be on the same line.
~Thx
Pavlina
Telerik team
answered
on
30 Jan 2017


