Telerik UI for WinUI Preview R3 2020: New Charts, Gauges and BulletGraph

Summarize with AI:
The second release of our preview version of Telerik UI for WinUI is here. R3 2020 brings a variety of data viz components—BulletGraph, Charts and Gauges, as well as WinUI 3.0 preivew 2 support.
In case you missed it—right after WinUI was announced at Build 2020, we released the first preview version of Telerik UI for WinUI (see the blog). Since then we've worked on improving and adding new features and components, so let's see what is new in this version of Telerik UI for WinUI!
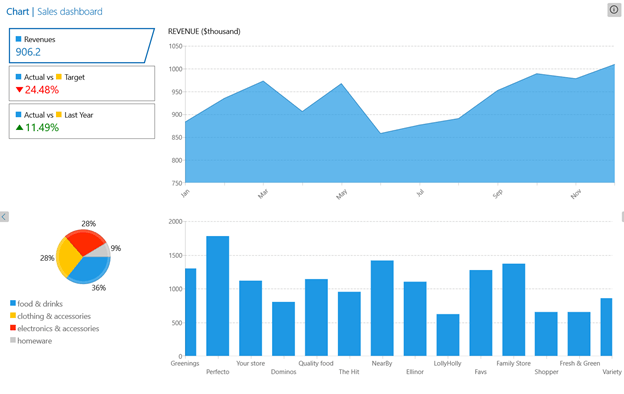
Charts

Introducing a solid variety of Charts! These Charts offer unmatched performance regarding loading time, drawing capabilities and real-time updates. Our Chart components are completely data-aware and may work in bound or unbound mode, depending on the requirements. All the Chart types (or series) are organized in hierarchies, depending on the coordinate system, used to plot data points—for example, we have RadCartesianChart (using the Cartesian coordinate system), RadPolarChart (using the radial coordinate system) and RadPieChart (using pie slices for proportional data visualization).
For details please visit the Chart section from our help documentation.
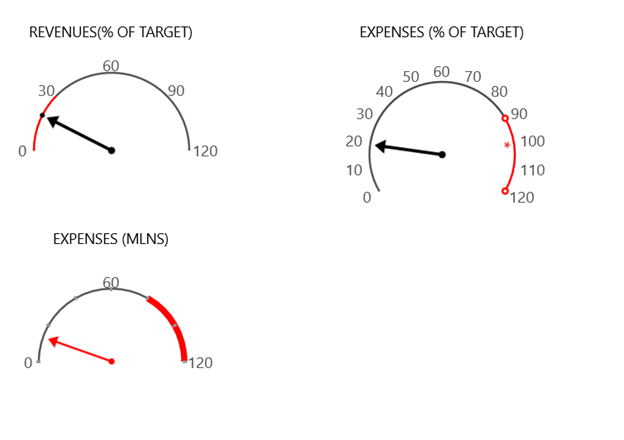
Gauges

Experiment with a rich assortment of circular, linear and numeric gauges with endless customization capabilities! The Telerik Gauges for WinUI will enable you to build the exact dynamic data visualization tool that you need.
Here are the key features of Gauge components:
- Radial Gauge: A circular scale with numbers and ticks. It can display multiple scales and ranges.
- Linear Gauge: A linear scale, which can display multiple scales and ranges.
- Indicators: Provides large set of indicators suitable for many scenarios.
- Rich Customization Capabilities: Variety of built-in behaviors starting from scales, indicators, labels, ticks etc.
- Animations: Built-in animations.
Make sure to visit the Gauges section in our online help documentation.
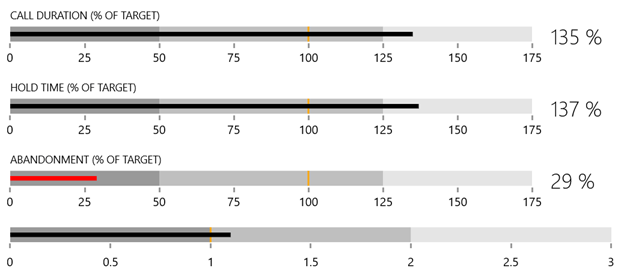
BulletGraph

Here are the main features of the control:
- Featured Measure: Indicates some progress.
- Comparative Measure: Indicates a certain threshold
- Ticks and Labels: Customizable Ticks and Labels
- Data binding support
- Styling and appearance - Telerik RadBulletGraph is a 100% lookless control, making it fully customizable
You can find more information in the BulletGraph section of our online help documentation.
Examples Application
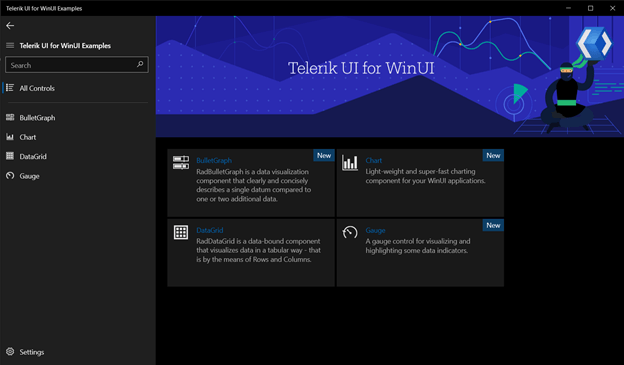
We added many demos for the new controls in our Telerik UI for WinUI Examples application. You will be able to find in the zip file with our app in the product downloads section of your Telerik account.

Experiment with Us
Delivering stellar products can only happen with your help. We invite you to become a collaborator—share your feedback (see the Contact Us section below) and help us shape the future of Telerik UI for WinUI. Suggest or recommend anything you’re missing, and we’ll use your input to add amazing new components and APIs to the roadmap.
During the experimental phase, Telerik UI for WinUI will be a free trial, and we hope you will continue sharing your use cases, experience and roadblocks with us.
Contact Us
- Get in touch by email – drop us a line, for anything related to product or just to say hi at TelerikWinUI@progress.com
- Feedback Portal – share any feature request (or bug reports) that you might have
- Telerik Forums – if you need any technical assistance with product let us know and we will help
Get the Bits
Try Telerik UI for WinUI Preview Now!
Sign Up for the Webinar
To see the new release in action, please join us on the Telerik R3 2020 webinar for Desktop and Mobile, on Thursday, October 1 @11:00 am – 12:00 pm ET.

