The New Telerik Reporting & Telerik Report Server R2 2020 are Here for You

Summarize with AI:
Check out everything that's new in the latest release of Telerik Reporting and Report Server, including updates to the Web Report Designer, Blazor Report Viewer, Barcodes and more.
It is now time for another major release of the Telerik Reporting solution, labeled R2 2020. It comes in a hard time for all of us as a community, but brings important additions on both our innovative side, namely the Web Report Designer, and our customers’ wishes like Barcode, web report viewers’ UX and much more.
Indeed, isolation days are challenging for every human being in every aspect, and building a product that customers love with a completely remote working team is far from an exception. Still, being dedicated and loving our products keeps us motivated to do whatever it takes to bring these products one step further, so they help you, our customers, solve your reporting challenges better and more easily.
Let’s see what we accomplished:
Web Report Designer
The Web Report Designer is a tool that gives the power to each web application developer to entitle their end-users Report Authors. End users can create or edit declarative report definitions without the need of a developer and without leaving the business application. The same designer is also integrated in the Report Server, making it a fully web solution.
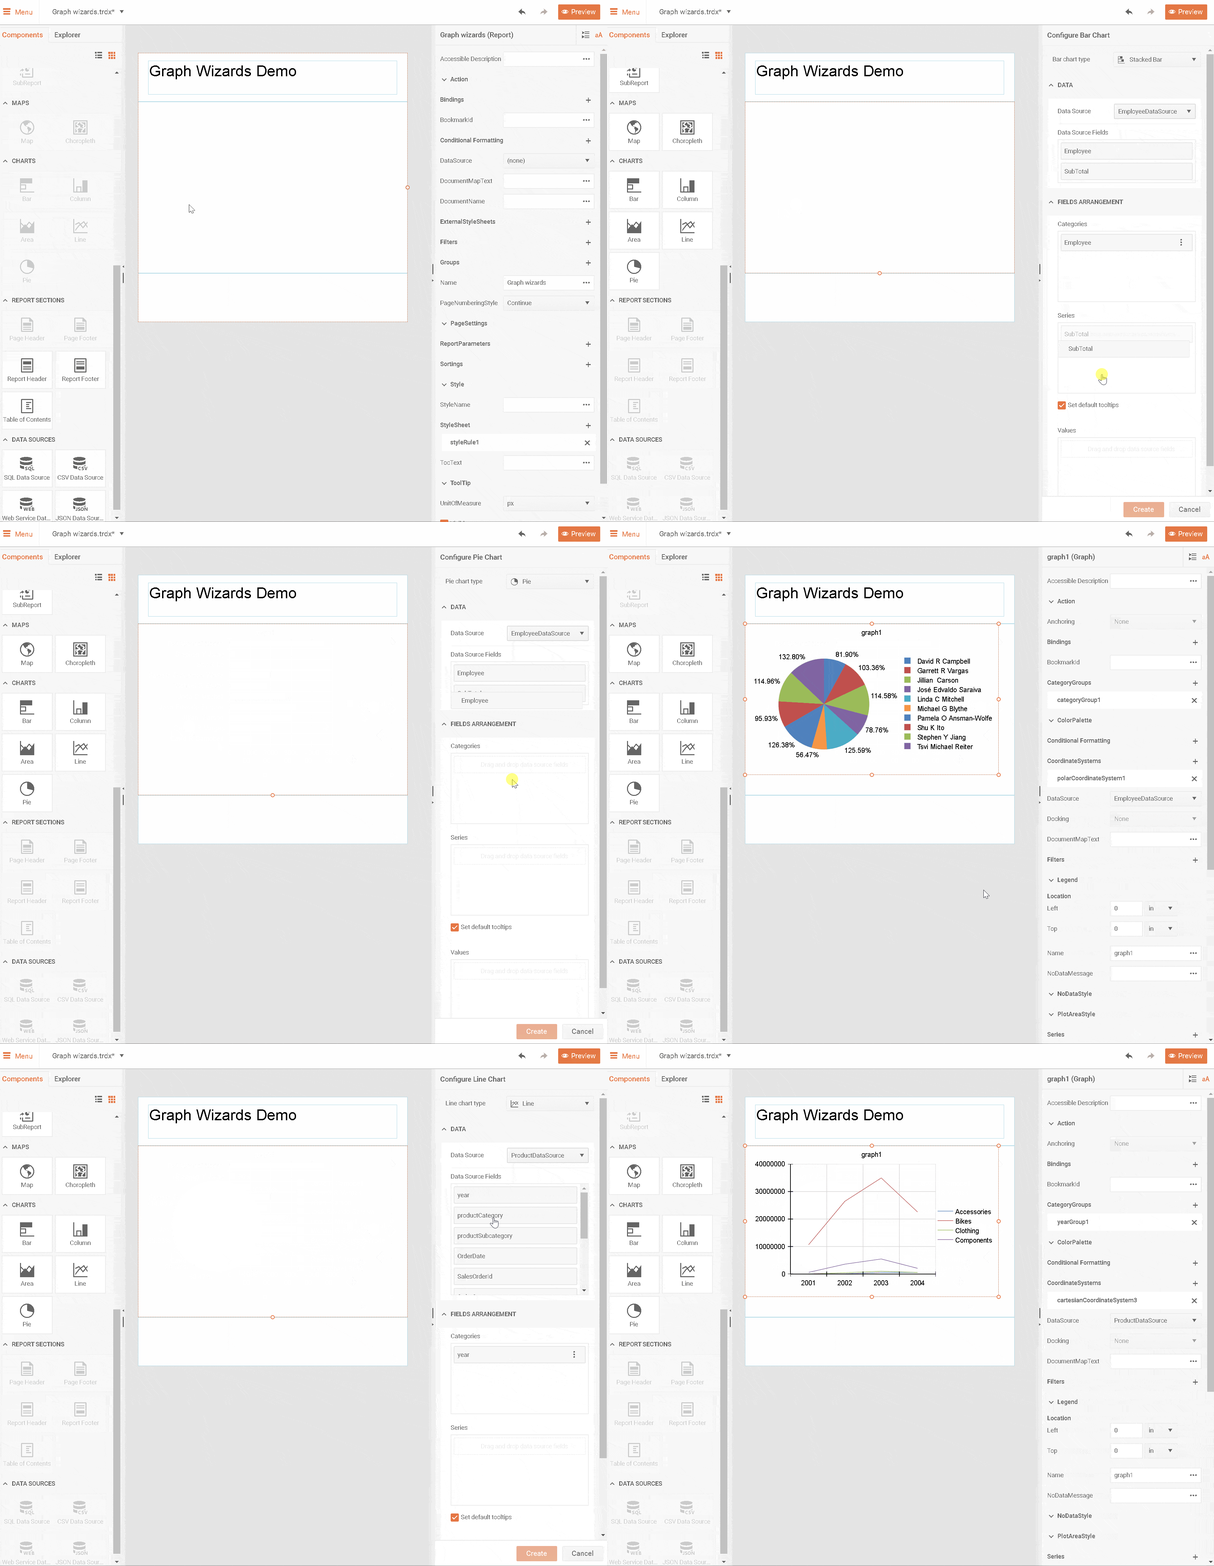
The Web Report Designer got a Graph item wizard, bringing easy setup of line, pie, area, bar and column charts. It is integrated into the Properties area instead of an obtrusive dialog window. Configuring the Categories, Series and Values is done intuitively by dragging and dropping the corresponding fields.
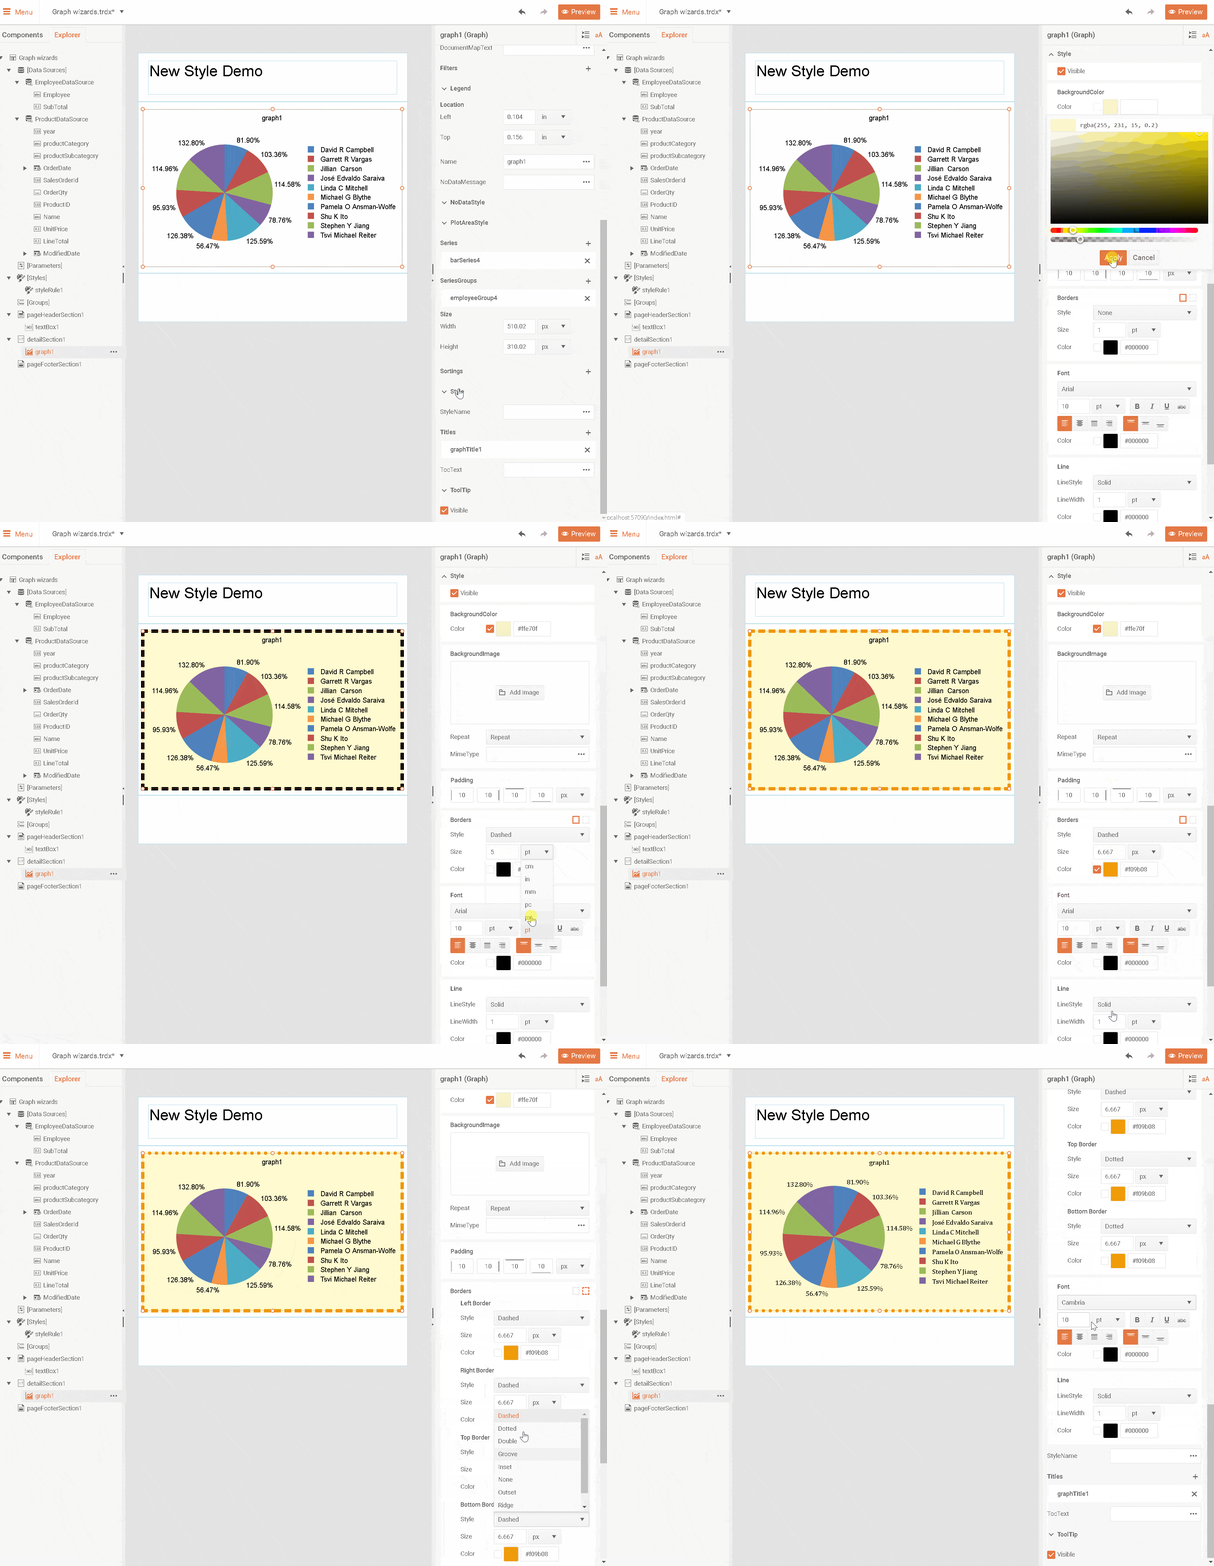
The designer received multiple User Experience related fixes and refinements of the Properties area editors and additional commands and behaviors in the Report Explorer area. The Web Designer also got a loader to indicate if a task takes more than expected.
The backend of the Web Report Designer also got an update. The client-server communication was not fast enough while bringing all the reporting API types and properties information on the client. This was easily observable in the full .NET Framework implementation of the designer backend.
To overcome this framework limitation, we consolidated these requests to make the overall communication 3x faster than before. Check out our Web Report Designer demo to see the result on your own.
Blazor Report Viewer V.2.0
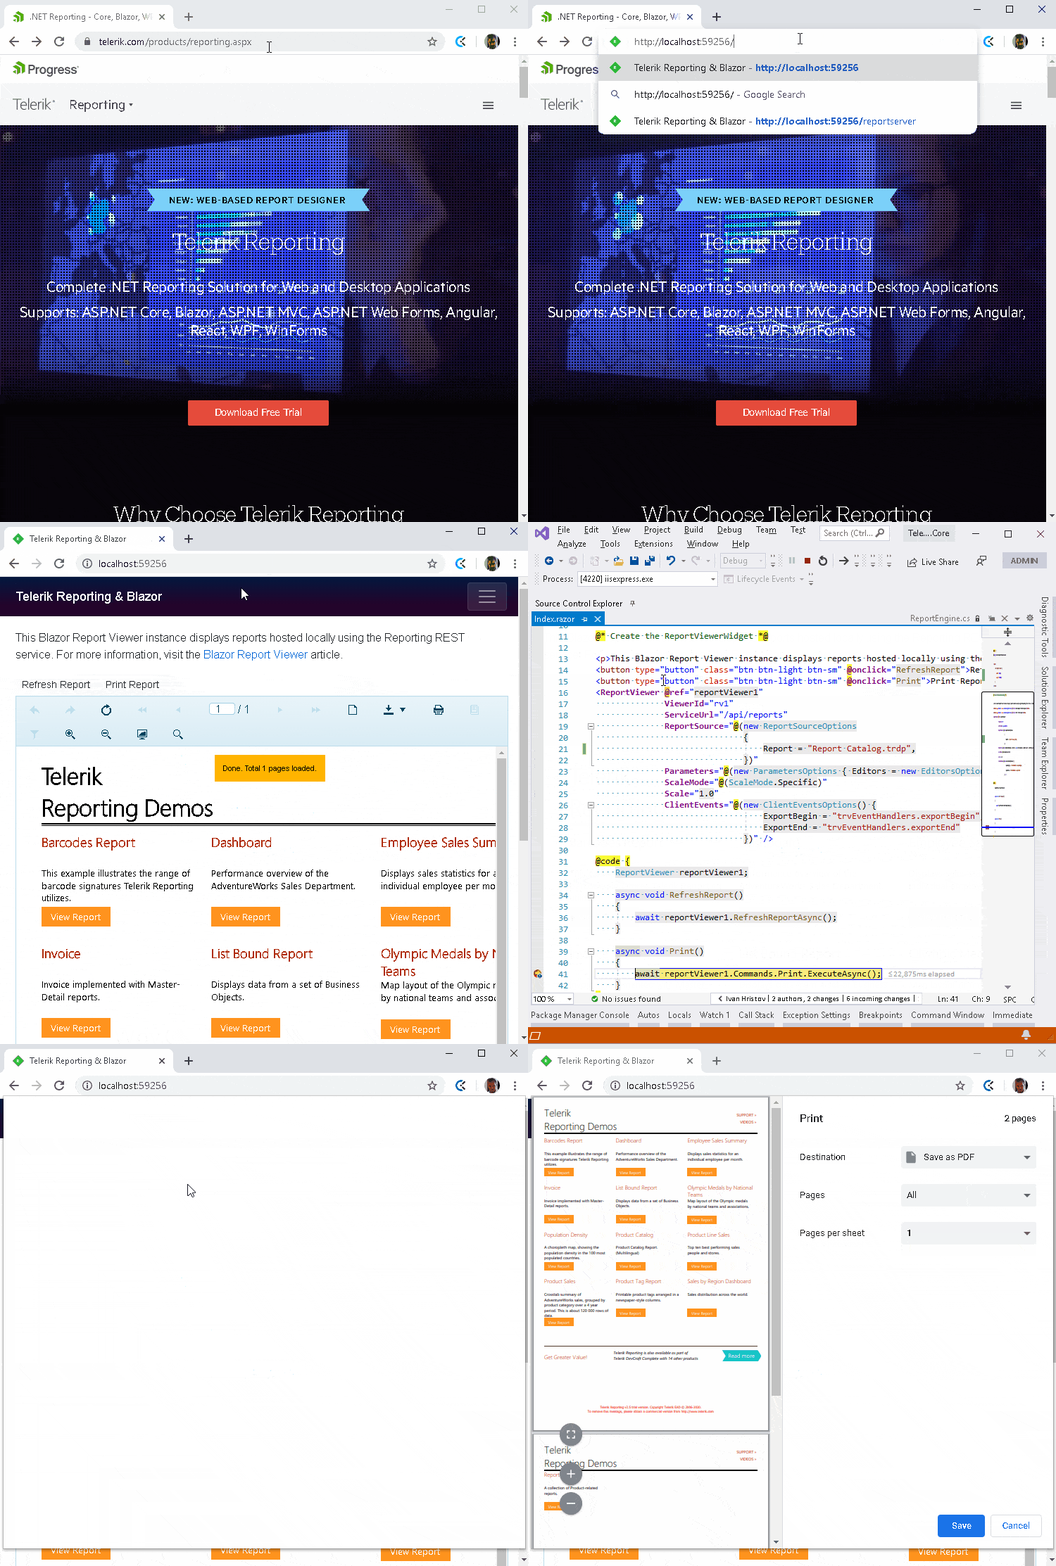
The report viewer for Blazor wraps the flexible HTML5/JS web report viewer and ensures the fast and easy previewing of reports directly within a Blazor application. With the latest changes the viewer got extended further with advanced properties, methods, and commands using the Razor syntax so that it covers the full API offered by the HTML5 Report Viewer.
Barcode Enhancement
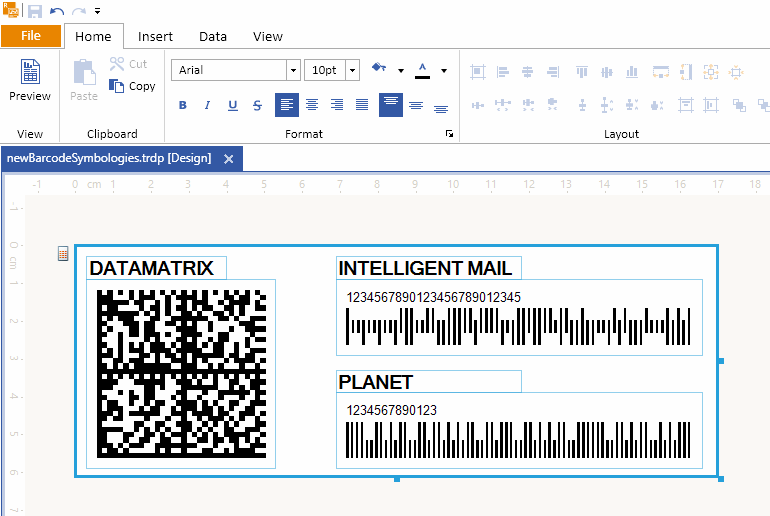
We enabled the report authors to use the highly requested Data Matrix barcode symbology into their reports, providing a rich set of configuration options. Keeping up the velocity, we are also introducing Planet and IntelligentMail symbologies, previously available in our Desktop Telerik control suites.
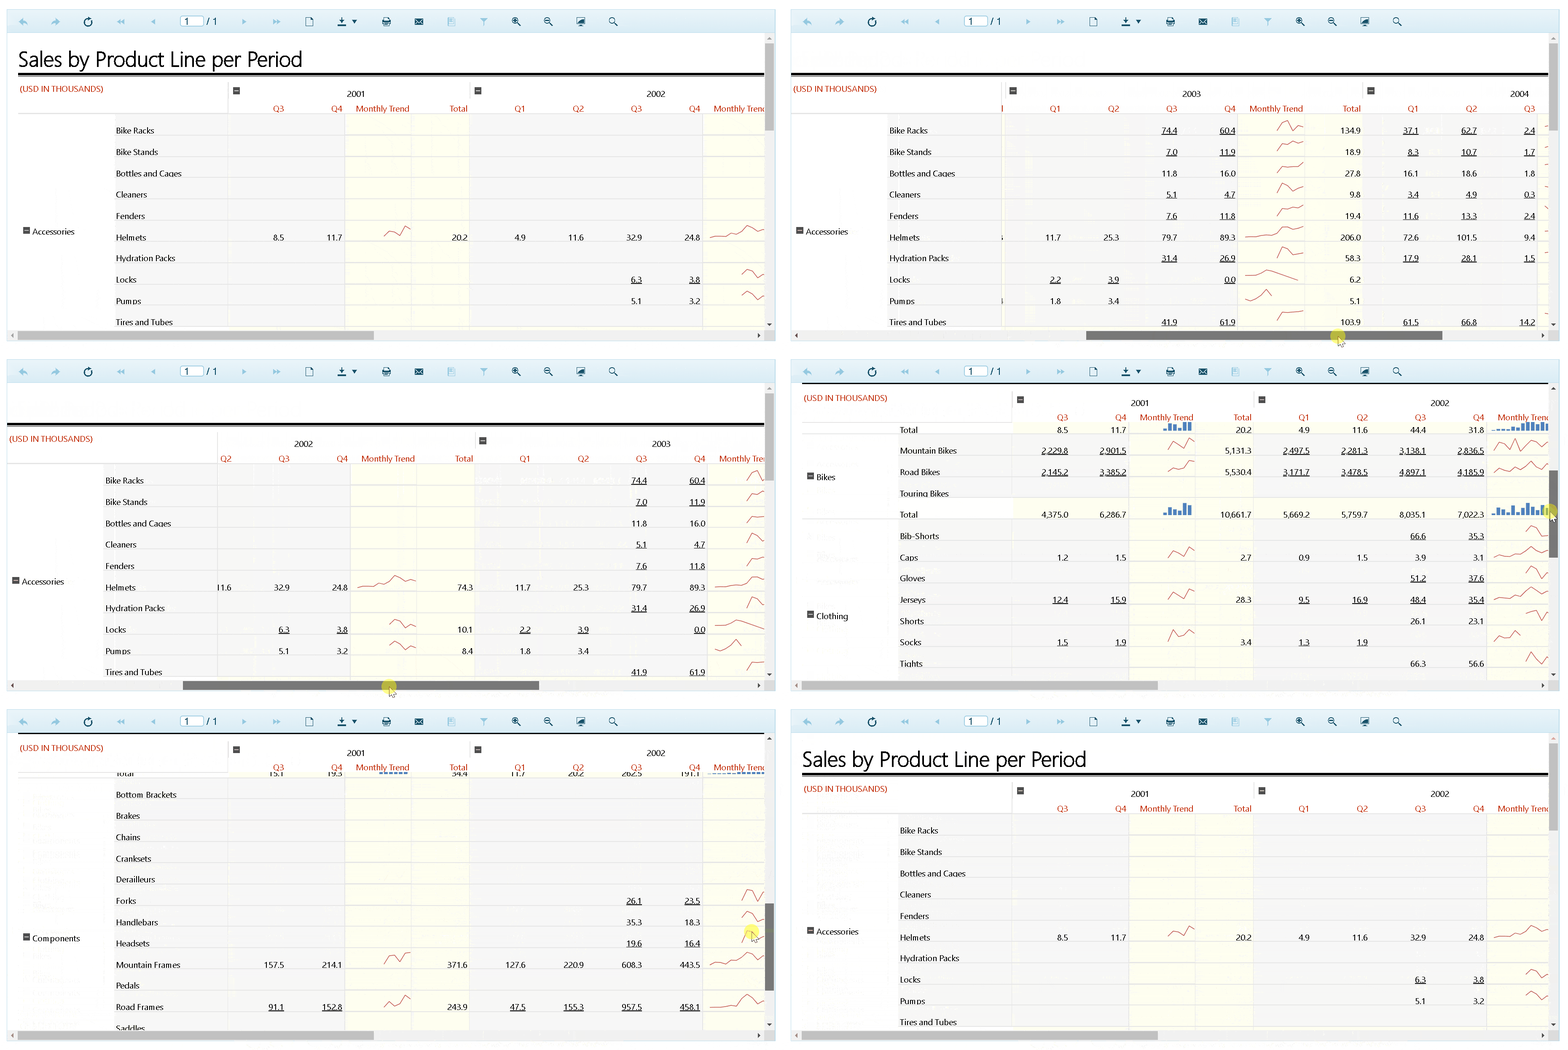
Ability to Freeze Table Header in Web-Based Report Viewers
We all know that the end-user is the most important party in the application development. As requested by the developers, for the end-users we have enabled Table headers’ freeze functionality. This would prevent the row and column headers from scrolling out of view while examining extensive data of a report document in our Web-based report viewers. The feature is like the one found in MS Excel, where users can keep an area of a worksheet visible while scrolling to another area.
Please give it a try and share any feedback here as a comment or in the respective feature request item on our feedback portal. The next logical step is to enable this functionality for more sections and items.
Base64-Encoded Images Support in PictureBox Item
This became kind of a hot topic in our support communication, so we added a built-in support for images provided as Base64 encoded string. Any property accepting image data can now handle its Base64 string representation instead of you having to extend the reporting engine with a dedicated user function or handling the scenario by other means.
Reports Web Service Improvements
As the most exercised way of reports generation, the service constantly gets improved based on your feedback in our support system and feedback portal.
The rendered report pages for preview are now compressed when they get stored in the storage of choice, so that they occupy less space and to save bandwidth as well. It uses GZip compressor by default, but this can be turned off or substituted with a custom compressor implementation in the service configuration object.
The second improvement enables more complex development scenarios when you need to have access to the report parameters when implementing a custom report source resolver. The parameters are now available in the respective method, and you also have a third method parameter identifying the purpose of the resolver call.
What is more, we introduced a new, dedicated ReportServiceConfiguration setting, called ReportDocumentResolver that empowers you to substitute the default report instantiation logic. For example, if the report definitions are stored in a database of choice, this addition will enable seamless report retrieval for both the master report and eventual sub reports.
All these additions enforced obsoleting the old interface IReportResolver and all its implementations, and introducing a new one, called IReportSourceResolver. All the changes are fully backwards compatible, so you can upgrade to the new version confidently, without any breaking changes.
Report Server
This release does not introduce dedicated Report Server improvements, but all of the above additions (well, excluding the Blazor viewer updates), are fully applicable for the users of the server.
The Web Report Designer is coming to a state of substituting the default Standalone Report Designer. The Barcodes and Images improvements enhance the report creation tooling. The Report preview gets richer and faster with freezing support and reports service enhancement correspondingly.
Bug Fixes
The list of the tackled bugs is impressive, and I will not try to determine which are the most important ones to list them. I realize how you, our users, perceive their importance differently, based on your current needs and the latest project, so please review the list in the release notes articles for Reporting & Report Server and I hope you will find the one that makes your developer life easier.
Happy coding and report authoring!
Get Started Today
Take them for a spin - try out the latest versions today with a free trial:
Try Reporting Try Report Server
You can pick these up as individual products, or as part of the great DevCraft bundles.
Telerik DevCraft is the finest software developer tools collection across .NET and JavaScript technologies, which includes modern, feature-rich and professionally designed UI components for web, desktop and mobile applications, reporting and report management solutions, document processing libraries, automated testing and mocking tools from the Telerik and Kendo UI suites. DevCraft will arm you with everything you need to deliver outstanding applications in less time and with less effort. With the backing of our legendary support team, which consists of the developers who build the products, and a ton of resources and trainings you can rest assured that you have a stable partner to rely on for your everyday challenges in your software development journey.

Milen Elkin
Milen Elkin is Product Manager of Telerik Reporting & Telerik Report Server. It’s been a while since he joined the company back in 2007. What drives his work is the belief that handling data should be easy. Besides his work, he likes running and cycling in the city of Sofia and enjoys the countless shapes and shades of green color up in the Bulgarian mountains.
