
Telerik Reporting and Kendo UI for Angular in Perfect Symbiosis

Summarize with AI:
Let’s see how to integrate the Kendo UI for Angular Data Grid with the Telerik Reporting Angular Viewer.
Angular is one of the top platforms for building mobile and desktop web applications. Some of the benefits that it brings are high quality of the application, a fast development process, effective cross-platform development and many others.
In the Blazor DataGrid meets Blazor Report Viewer blog post, you have seen how to pass data from the Telerik UI for Blazor Grid to the Telerik Blazor Report Viewer. A similar approach was also provided in the Embedding Beautiful Reporting Into Your React Applications. In it, the Kendo React Data Grid was supplying the Telerik Reporting React Viewer with data.
In this blog post, we will continue the series showing the interaction between the different Progress products. Now it’s time to join the Kendo UI for Angular Data Grid with the Telerik Reporting Angular Viewer. Let’s get started!
The implementation is divided into three main parts:
Kendo UI for Angular Data Grid
The Kendo UI for Angular Data Grid includes a comprehensive set of ready-to-use features covering everything from paging, sorting, filtering, editing and grouping to row and column virtualization, exporting to PDF and Excel, and accessibility support.
The Grid is built from the ground up and specifically for Angular, so you get a high-performance control that delivers lightning-fast speeds, integrates tightly with your application and with the rest of the Kendo UI for Angular components, and is highly customizable.
To get it set up:
- Create the Angular application and install the Grid’s package (find more details in the Getting Started with the Kendo UI for Angular Grid article):
ng add @progress/kendo-angular-grid - Insert the speakers.ts file which contains the speakers objects. The file can be found in the sample project at the end of the article.
- Add the Grid and MultiSelect components.
- Implement the methods required for filtering the data in the grid when some of the filters are changed:
import { Component, ViewChild } from '@angular/core';
import { filterBy, CompositeFilterDescriptor } from '@progress/kendo-data-query';
import { speakersData } from '../data/speakers';
const distinctCategories = data => data
.filter((x, idx, xs) => xs.findIndex(y => y.DaySpeaking === x.DaySpeaking) === idx);
@Component({
selector: 'my-app',
templateUrl: './app.component.html'
}
)
export class AppComponent {
public filter: CompositeFilterDescriptor = null;
public gridData: any[] = filterBy(speakersData, this.filter);
public categories: any[] = distinctCategories(speakersData);
public filterChange(filter: CompositeFilterDescriptor): void {
this.filter = filter;
var filteredData = filterBy(speakersData, filter);
this.gridData = filteredData;
}
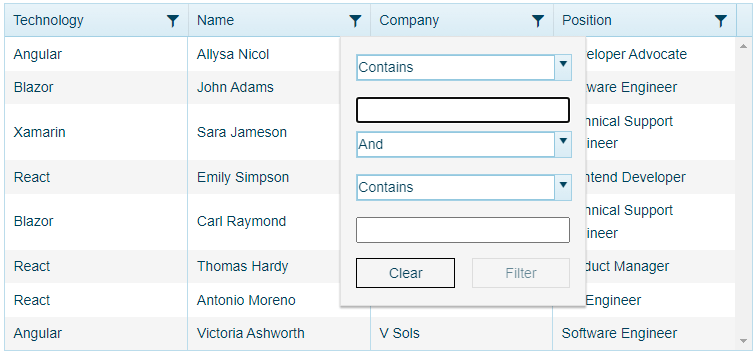
}And here we have the first outcome of our implementation:
Let’s continue with the Telerik Reporting part.
Telerik Reporting REST Service
Our HTML-based Report Viewers require a running instance of the Telerik Reporting REST Service or the Telerik Report Server to display reports. The Telerik Reporting REST service provides an API over HTTP to the report generation engine, which allows exporting report documents in all supported rendering formats.
The project that hosts the REST service can target .NET Framework or .NET Core. For this example, we will pick the .NET 6 demo project with the REST Service from the installation folder of Telerik Reporting. The project is in the Examples -> CSharp -> .NET 6 -> ReportingRestServiceCorsDemo subfolder.
All required steps for building the Telerik Reporting REST Service can be found in the How to Host Reports Service in ASP.NET Core in .NET 6 with Minimal API article.
You don’t have Telerik Reporting installed yet? No worries, you only need to start your free trial. You will find this project and many other examples in the installation folder.
- Copy the REST service project and place it in a separate location.
- Open the project and add a new folder called “Reports.”
- Copy the Speakers report which can be found in the Report Designer -> Examples subfolder of the installation folder of Telerik Reporting.
- In Program.cs, change the reportsPath so the service will look for the report from the newly created folder:
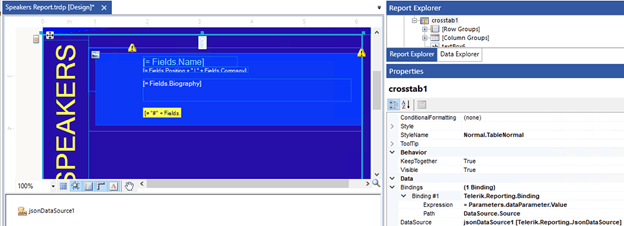
var reportsPath = System.IO.Path.Combine(builder.Environment.ContentRootPath, "Reports");- Open the Speakers Report and replace the Object DataSource with an empty JSON Data Source. Set the DataSource property of the crosstab to be the JsonDataSource. Later, we will set the content of the JSON DataSource from the Kendo UI for Angular Data Grid.
- We will transfer the data by using a report parameter. Add a new one called “dataParameter.” It should be of type String.
- Add a new Binding to the crosstab as follows:
Property path: DataSource.Source
Expression: = Parameters.dataParameter.Value
- Save the report and run the REST service project. To ensure that the service operates, run the application and navigate to {applicationRoot}/api/reports/version, which will return the used version of Telerik Reporting.
Another option is to navigate to {applicationRoot}/api/reports/formats. It should return a JSON representing the supported rendering extensions. More details on this approach can be found in the How to set the content of JsonDataSource through report parameter KB article.
And now we are ready for the culmination of our solution—adding the Angular Report Viewer and passing the data from the grid to the report.
Telerik Reporting Angular Report Viewer
The Telerik Reporting Angular Viewer component is built on top of the HTML5 Report Viewer, which is the base for all other Web-technologies report viewers as well. Let’s add it to our application:
- Install the jQuery and Angular viewer packages:
-npm install jquery
-npm install @progress/telerik-angular-report-viewer - Add the viewer component:
//report-viewer.component.ts
import { AfterViewInit, Component, ViewChild } from '@angular/core';
import { TelerikReportViewerComponent } from '@progress/telerik-angular-report-viewer';
import { StringResources } from './stringResources';
import { speakersData } from '../../data/speakers';

@Component({
    selector: 'report-viewer',
    templateUrl: './report-viewer.component.html',
    styleUrls: ['./report-viewer.component.css']
})

export class ReportViewerComponent implements AfterViewInit {
    @ViewChild('viewer1', {}) viewer: TelerikReportViewerComponent;
    speakerObjects = JSON.stringify(speakersData);
    title = "Report Viewer";
    viewerContainerStyle = {
        width: '100%',
        height: '1000px',
        ['font-family']: 'ms sans serif'
    };
}
//report-component.html <tr-viewer #viewer1 [containerStyle]="viewerContainerStyle" [serviceUrl]="'http://localhost:59655/api/reports/'" [reportSource]="{ report: 'Speakers Report.trdp', parameters: { 'DataParameter' : speakerObjects } }" [viewMode]="'INTERACTIVE'" [scaleMode]="'SPECIFIC'" [scale]="1.0" [ready]="ready" [viewerToolTipOpening]="viewerToolTipOpening" [enableAccessibility]="false"> </tr-viewer>More details on how to add the Angular Report Viewer to your application can be found in the How to Use Angular Report Viewer with Angular CLI article.
- Finally, with the following piece of code, we will send the data from the grid to the report:
export class AppComponent {
    @ViewChild('reportViewer1', {}) viewer: ReportViewerComponent;

    public get telerikReportViewer() {
        return this.viewer.viewer;
    }
...

    public setViewerData(data) {
        var rs = {
            report: this.telerikReportViewer.reportSource.report,
            parameters: { DataParameter: data }
        };
        this.telerikReportViewer.setReportSource(rs);
    }

    public filterChange(filter: CompositeFilterDescriptor): void {
        . . .
        this.setViewerData(JSON.stringify(filteredData));
    }
}
Now we are ready with our masterpiece. It’s cool, isn’t it?
Source Code
The source code for this project can be found in our GitHub repository. To use Telerik or Kendo UI products, you will need to provide a license key. This can be through a free trial or when you own the commercial license (details below).
Want To Try Telerik Reporting?
Telerik Reporting is a complete, easy-to-use and powerful .NET embedded reporting tool for web and desktop applications that supports: Blazor, ASP.NET Core, ASP.NET MVC, ASP.NET AJAX, HTML5/JS, Angular, React, Vue, WPF, WinForms and UWP. Also available as a part of our Telerik DevCraft bundle, Reporting allows you to create, style, view and export rich, interactive and reusable reports to attractively present analytical and any business data. Add reports to any business application through report viewer controls. Export the ready reports to more than 15 formats.
If you still have not tried it, you can start a free trial to take a closer look. We also provide a support service we are proud of and resources that will help you along the way.
Want To Try Kendo UI for Angular?
Kendo UI for Angular delivers UI components to meet all app requirements for data handling, performance, UX, design, accessibility and so much more. Explore it through a or as part of the Telerik DevCraft bundle.

Neli Todorova
Neli Todorova was a Technical Support Engineer in the Telerik Reporting division.
Related Posts
Comments
All articles
Topics
Web MobileMobile
Desktop
Design
Productivity
People
