Application Analytics - Taking Advantage of Integrated Analytics with UI for WinForms Controls
Summarize with AI:
How much do you know about how your users use your application? I mean REALLY know? Do you know exactly how many times your end-users access the admin portion of your application? Do you know what screen resolution they are using? How about which Operating System they have? Precise metrics around feature use and environmental contexts can help your team make critical decisions about future work on your application. Is it safe to drop support for Windows XP yet? Now you’ll know. Which areas do you need to focus feature enhancement in? Discover it with precise metrics. What parts of your application does it make sense to pay down technical debt in? These are just a few of the questions that are answered when you take advantage of application analytics. In this article, I will show you how to create an analytics project in the Telerik Platform portal. We’ll examine how to configure a new Telerik Windows Forms Application project for analytics as well as how to integrate a monitor into an existing Windows Forms application. Finally we will look at some of the data captured by an analytics monitor in a sample application.
Setting up application features for analytics may sound like a big job, but lucky for us, many of the UI for WinForms controls already come equipped with integrated application analytics. This means that once a monitor is setup in your application the controls are already wired up to provide feature use analytics information automatically. In this article we’ll see just how easy it is to gain valuable insight into how your end-users interact with your application using UI for WinForms and Telerik Analytics.
Setting up an Analytics Project in the Telerik Platform
If you haven’t already done so, you will need to create a Telerik Platform account. Log into your account and open an existing workspace (or create a new one) to host your analytics project. Create an analytics project by clicking on the “Create Analytics project” button.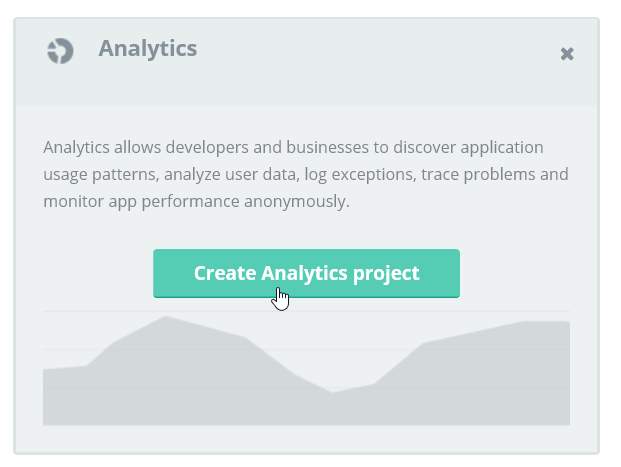
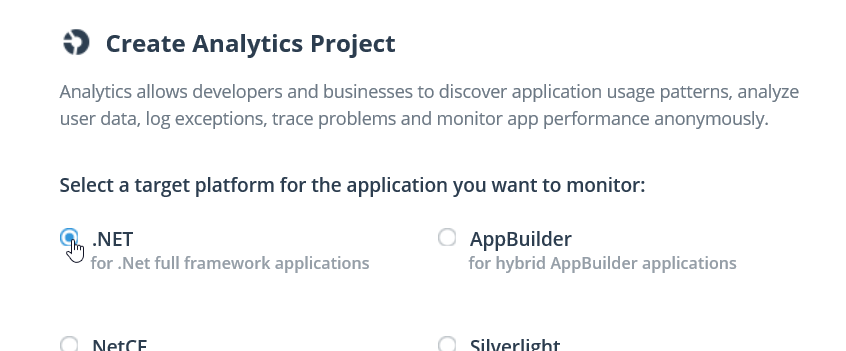
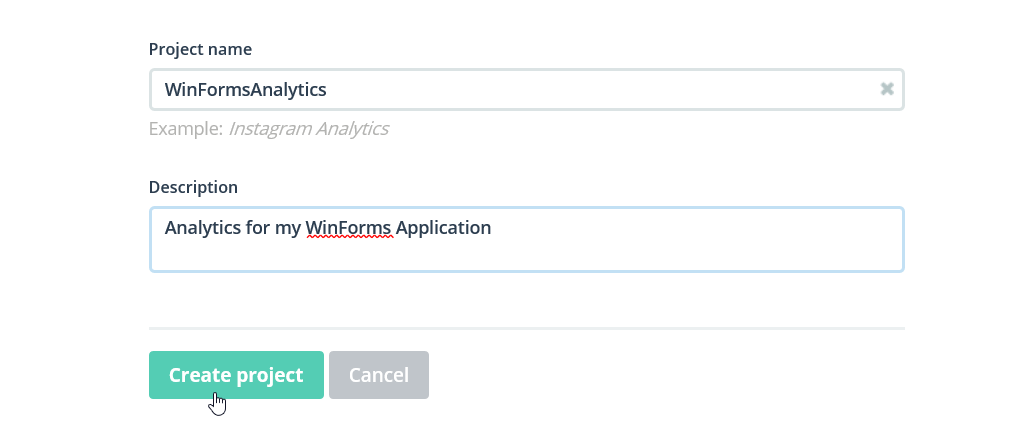
Next, you will be asked to name your project and provide a project description.
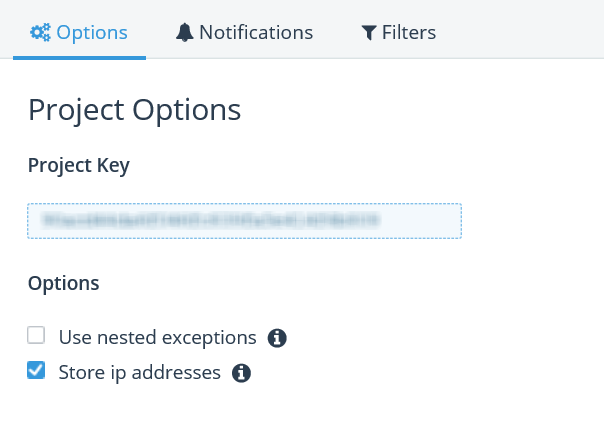
 The project will now spin up. A getting started screen will then be displayed to you. Using the left-hand menu, select Settings to obtain the project key.
Creating a new WinForms Project powered with Telerik Analytics
Open Visual Studio, and create a new Telerik Windows Forms Project.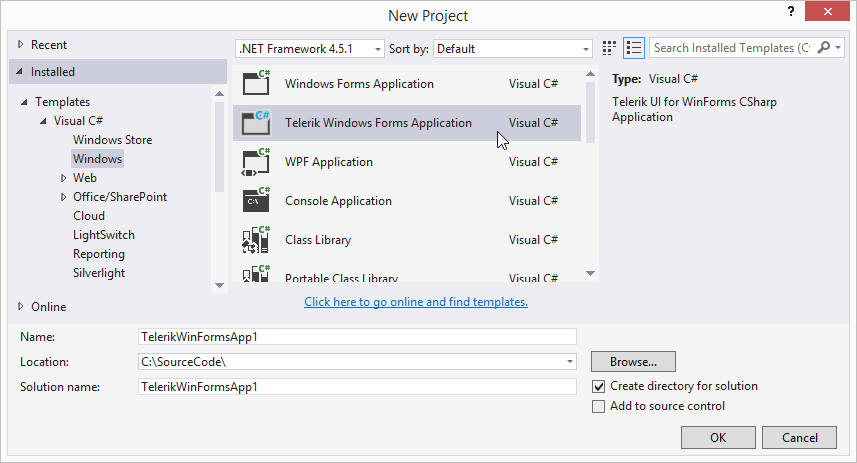
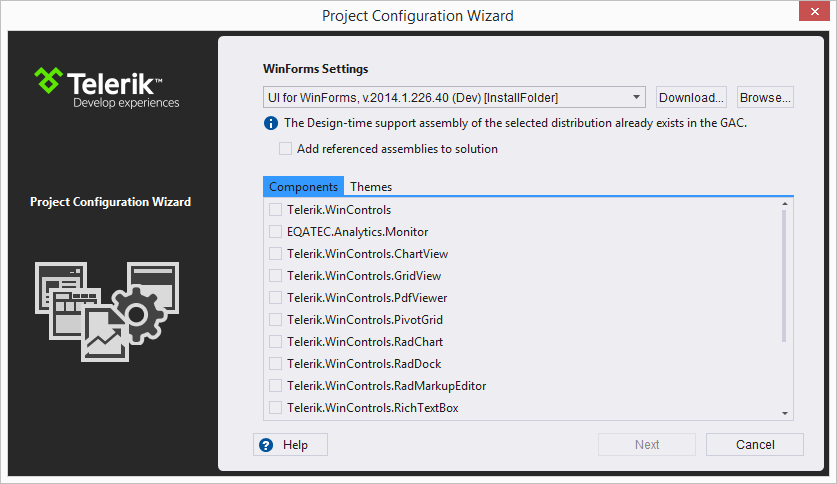
Click on Next, and you will now be able to initialize the project with Application Analytics automatically integrated. Ensure the checkbox to integrate Telerik Analytics in the new project is checked. Then copy and paste your Project Key from the Settings section of your Telerik Platform Analytics project and click Finish.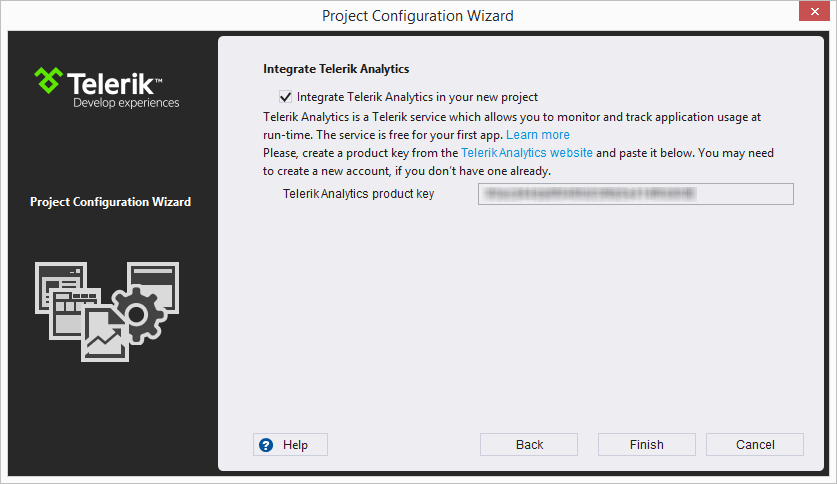
Once your project has finished being created, you can open Program.cs and see the initialization code for the Analytics monitor.
EQATEC.Analytics.Monitor.IAnalyticsMonitor monitor =
            Telerik.WinControls.Analytics
                .TraceMonitor
                .Initialize("YOUR_PROJECT_KEY_HERE");
Adding Telerik Analytics to an existing WinForms Project
If you have an existing project that you are looking to integrate with Telerik Analytics, you can add a reference to Equatec.Analytics.Monitor.dll from the UI from WinForms control suite. Alternatively, you can also right click on your UI for WinForms project and configure your project.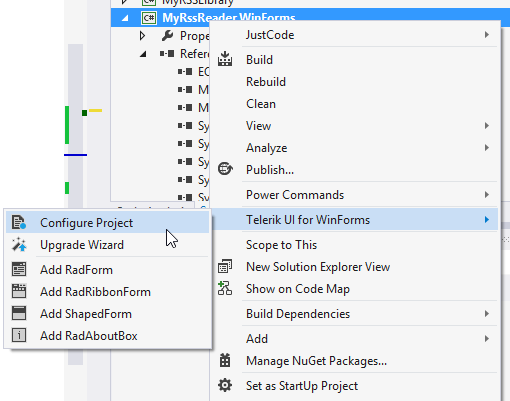
This will display the Telerik Project Configuration dialog where you can then check the checkbox next to the EQATEC.Analytics.Monitor component.
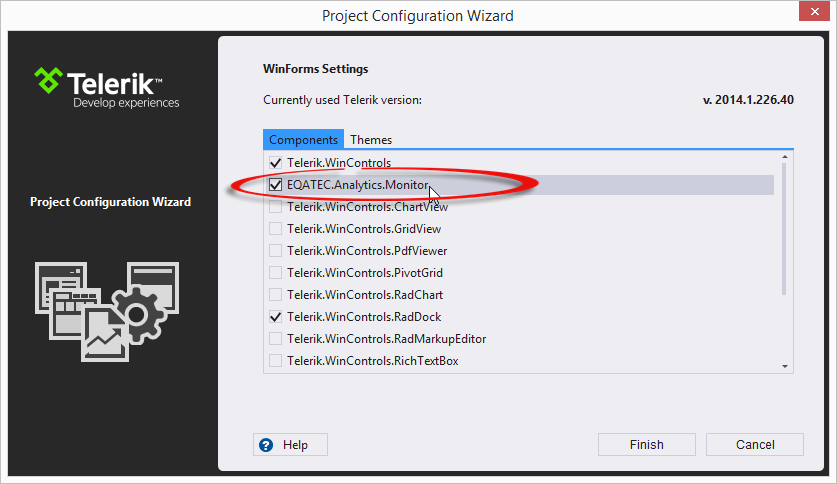
All that is left now is to insert the monitor initialization code in the Main method of the Program.cs file.
EQATEC.Analytics.Monitor.IAnalyticsMonitor monitor =
            Telerik.WinControls.Analytics
                .TraceMonitor
                .Initialize("YOUR_PROJECT_KEY_HERE");
Monitoring your Application
Now that you have a monitor added to your application, you’ll be pleased to know that this is all the setup that is required. By default, UI for WinForms controls that are built with integrated support for analytics are enabled to start capturing analytics information. This means that when you run the application, the analytics monitor will automatically send analytics details from the controls back to the Telerik Platform. If there is a certain case where you decide you want to turn off analytics for a specific control it’s as simple as setting the EnableAnalytics property to false on the control itself.
this.saveFeedsButton.EnableAnalytics = false;Following on an example from a previous analytics article, I have implemented a Blog Reader client using Windows Forms. Some of the analytics enabled controls used in this application are RadForm, RadDock, RadTreeView, RadButton, RadPanorama, RadBindingNavigator and more. You can run this application yourself by downloading the source code and providing your Telerik Analytics project key in the Program.cs file.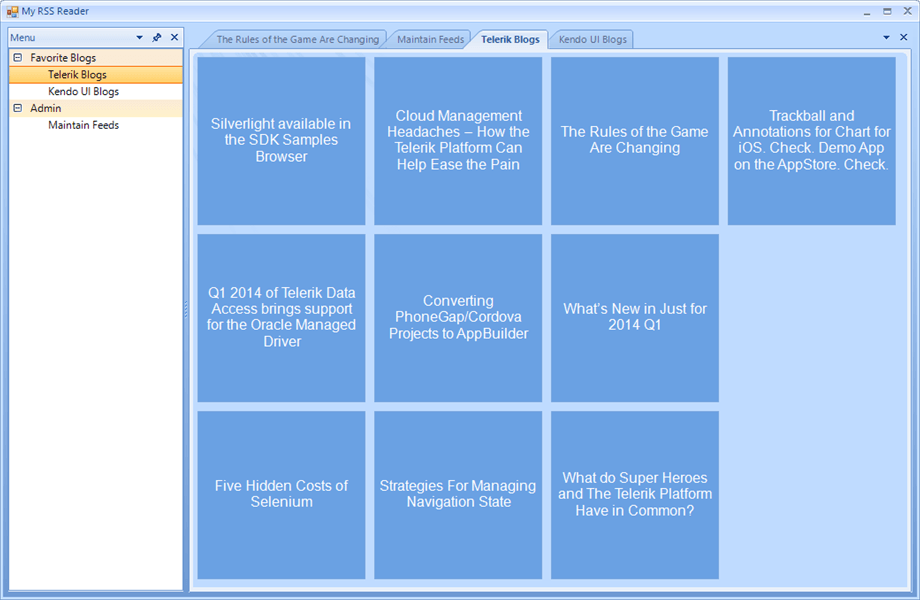
After the application has been run and you have interacted with the various controls, you can then log into the Telerik Platform Portal and access your Analytics project. You will then be displayed your Dashboard. You can access a live view of incoming data by selecting the “Live” menu item beneath the Developer Reports section located in the left-hand menu. This will show you information regarding the most recent sessions of your application.
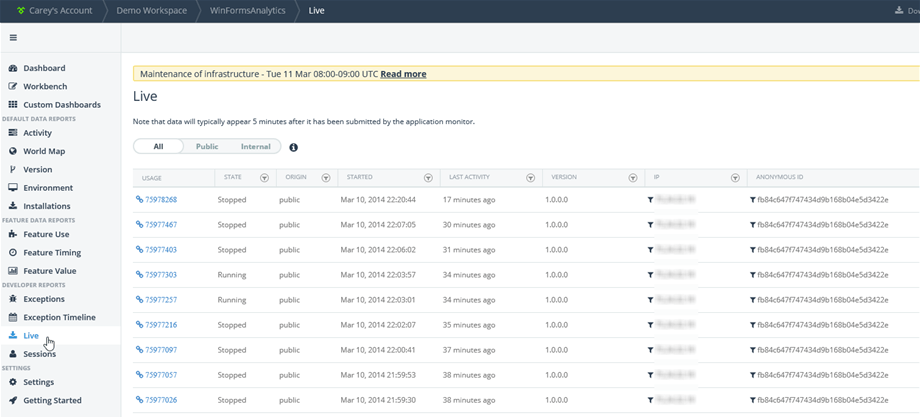
By clicking on the hyperlink in the USAGE column, you will be brought to a further breakdown of the activities that occurred within that specific user session.![]()
You will also be shown some high level information about the end user for that session such as their geographical location, the operating system that they use, the number of processors and RAM in the machine, and more.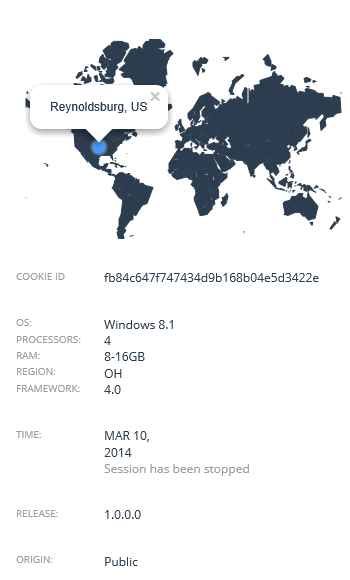
Wrapping Up
As Analytics are gathered over time, you will begin to see patterns. The Feature Use report will identify which features are the most heavily used, and with this information you can prioritize bug fix work and plan future enhancements. The Environment report provides detailed information about your end users including machine horsepower, screen resolution, number of monitors, operating systems, languages, and more. Armed with this information, you know just how many people will be impacted if you decide to, for instance, stop supporting Windows XP in order to focus development efforts on Windows 8.1. The World Map is also a great source of information, it will allow you to interactively drill down into a map visually to see application usage counts by country, state/province, and finally into the city level. You can also monitor and track unhandled exceptions that occur in your application, providing you the detailed information you need to fix the issue before it is reported by your end users. This is just a sampling of the many great insights that Telerik Analytics can provide to you about your application.

Remember that subscribing to Telerik Analytics for your first application is always free (for up to 100 users), so there is no risk to evaluating the service. Be sure to check it out!
Download Source Code
Download UI for WinForms
Telerik Platform

Carey Payette
Carey Payette is a Senior Software Engineer with Trillium Innovations (a Solliance partner), an ASPInsider, a Progress Ninja, a Microsoft Certified Trainer and a Microsoft Azure MVP. Her primary focus is cloud integration and deployment for the web, mobile, big data, AI, machine learning and IoT spaces. Always eager to learn, she regularly tinkers with various sensors, microcontrollers, programming languages and frameworks. Carey is also a wife and mom to three fabulous boys.
