Telerik Reporting
What's New R3 2018
What's New HistoryPie Charts Data Consolidation
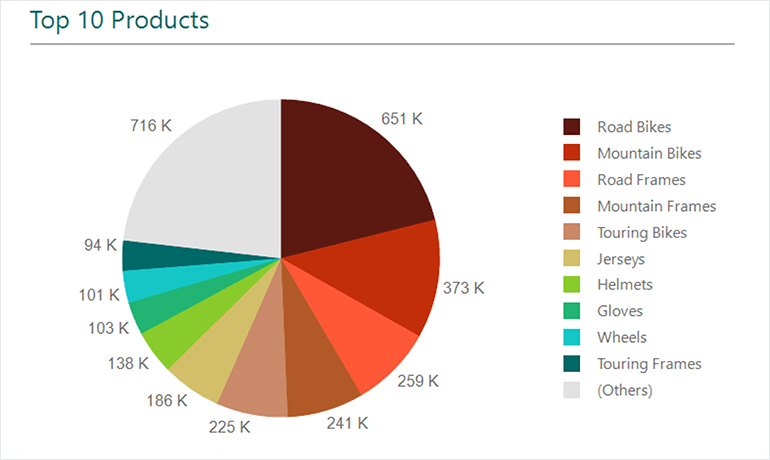
With R3 2018, we've enabled the representation and readability of pie chart data in an easily consumable form. Report authors can now consolidate small slices in pie or bar charts wherever applicable so that chart visualizations don’t get cluttered with insignificant data.

PDF/A Export
PDF is the most used export format in Telerik Reporting. In our third release of 2018, we’ve added support for the PDF/A ISO-standardized version of this format, specialized for use in archiving and long-term preservation of electronic documents. It is self-contained in terms of needed assets (e.g. fonts, encryptions, annotations) ensuring that the document will look exactly as-is on any machine.

Email Report from The Report Viewers
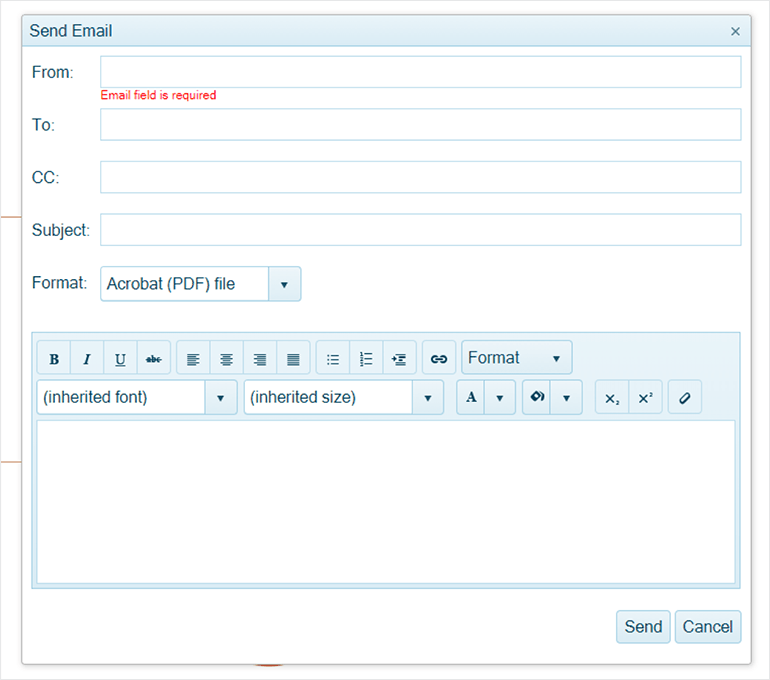
With R3 2018, we’ve enhanced the end-user experience by allowing users to easily compose a new email message containing the generated report as an attachment. That eliminates exporting and saving the file on the system prior to sharing thru e-mail.

Correctly Display Missing Values in Graph’s Line and Area Series
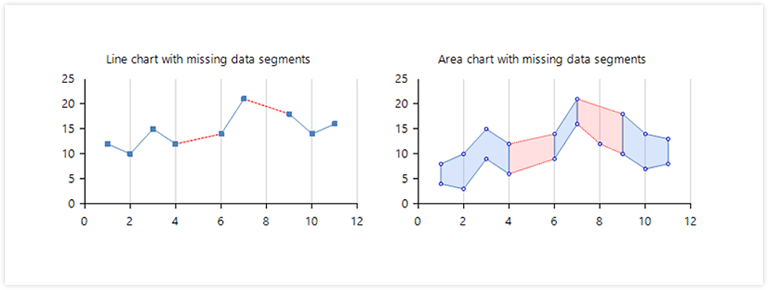
The Graph item now correctly represents the data points with missing values in line and area series in Cartesian coordinate system, allowing to configure the appearance and styling of the segments as needed.

New features & Roadmap
Have a feature request?
Post your feedback via the Reporting feedback portal or the public forums
What's new across all Telerik products?
See the updates feed

Next Steps
See Telerik’s Report Designer in action and check how much it can do out of the box
Check out the offers. Purchase an individual license for .NET reporting or treat yourself to one of our bundles.
Try Telerik’s .NET Reporting tool with dedicated technical support.
