DataBinding
The following article will show you how to bind the RadDiagram to ViewModel collections which represent nodes and edges of a Graph.
Please note that the examples in this tutorial are showcasing Telerik Windows8 theme. In the Setting a Theme article you can find more information on how to set an application-wide theme.
Defining GraphSource
In order to bind a RadDiagram successfully you have to use its GraphSource property and create a collection that implements the IGraphSource or IGraphSource<T>. The IGraphSource interface basically describes the elements (items and links (or nodes or edges)) of an MVVM graph source.
Example 1: IGraphSource interfaces
public interface IGraphSource
{
    IEnumerable<ILink> Links { get; }
    IEnumerable Items { get; }
}

public interface IGraphSource<T> : IGraphSource
{
    new IEnumerable<ILink<T>> Links { get; }
    new IEnumerable<T> Items { get; }
}Public Interface IGraphSource
ReadOnly Property Links() As IEnumerable(Of ILink)
ReadOnly Property Items() As IEnumerable
End Interface
Public Interface IGraphSource(Of T)
Inherits IGraphSource
Shadows ReadOnly Property Links() As IEnumerable(Of ILink(Of T))
Shadows ReadOnly Property Items() As IEnumerable(Of T)
End InterfaceSo let's start with creating a ViewModel for the nodes of our Graph (Diagram). We will create the class PascalNode that will have 'Position' property of type Point and 'PascalNumber' of type int:
Example 2: Creating a ViewModel for nodes
public class PascalNode
{
    public Point Position
    {
        get;
        set;
    }
    public int PascalNumber
    {
        get;
        set;
    }
}Public Class PascalNode
Public Property Position() As Point
Public Property PascalNumber() As Integer
End ClassNow we need a ViewModel for the edges (links) of the Graph. Let's call it PascalEdge. Note that this class must implement the ILink
Example 3: Creating a ViewModel for links
public class PascalEdge : ILink<PascalNode>
{
    public PascalNode Source
    {
        get;
        set;
    }

    public PascalNode Target
    {
        get;
        set;
    }

    object ILink.Source
    {
        get
        {
            return this.Source;
        }
        set
        {
        }

    }

    object ILink.Target
    {
        get
        {
            return this.Target;
        }
        set
        {
        }
    }
}Public Class PascalEdge
Implements ILink(Of PascalNode)
Public Property Source() As PascalNode
Public Property Target() As PascalNode
Private Property ILink_Source() As Object Implements ILink.Source
Get
Return Me.Source
End Get
Set(ByVal value As Object)
End Set
End Property
Private Property ILink_Target() As Object Implements ILink.Target
Get
Return Me.Target
End Get
Set(ByVal value As Object)
End Set
End Property
End ClassNow we can successfully create an IGraphSource class to hold collection of nodes and edges:
Example 4: Implementing IGraphSource
public class PascalTriangleGraphSource : IGraphSource
{
    public PascalTriangleGraphSource()
    {
        this.InternalItems = new ObservableCollection<PascalNode>();
        this.InternalEdges = new ObservableCollection<PascalEdge>();
    }

    public ObservableCollection<PascalNode> InternalItems
    {
        get;
        private set;
    }

    public ObservableCollection<PascalEdge> InternalEdges
    {
        get;
        private set;
    }

    IEnumerable<ILink> IGraphSource.Links
    {
        get { return this.InternalEdges; }
    }

    System.Collections.IEnumerable IGraphSource.Items
    {
        get { return this.InternalItems; }
    }
}Public Class PascalTriangleGraphSource
Implements IGraphSource
Public Sub New()
Me.InternalItems = New ObservableCollection(Of PascalNode)()
Me.InternalEdges = New ObservableCollection(Of PascalEdge)()
End Sub
Private privateInternalItems As ObservableCollection(Of PascalNode)
Public Property InternalItems() As ObservableCollection(Of PascalNode)
Get
Return privateInternalItems
End Get
Private Set(ByVal value As ObservableCollection(Of PascalNode))
privateInternalItems = value
End Set
End Property
Private privateInternalEdges As ObservableCollection(Of PascalEdge)
Public Property InternalEdges() As ObservableCollection(Of PascalEdge)
Get
Return privateInternalEdges
End Get
Private Set(ByVal value As ObservableCollection(Of PascalEdge))
privateInternalEdges = value
End Set
End Property
Private ReadOnly Property Links() As IEnumerable(Of ILink) Implements IGraphSource.Links
Get
Return Me.InternalEdges
End Get
End Property
Private ReadOnly Property Items() As System.Collections.IEnumerable Implements IGraphSource.Items
Get
Return Me.InternalItems
End Get
End Property
End ClassOur next step is to create a function that accepts integer as a parameter and fills the GraphSource collection with PascalNodes and PascalEdges:
Example 5: Populating the graph source
const int ROOT_X_Position = 400;
const int ROOT_Y_Position = 20;
const int X_DELIMITER_WIDTH = 80;
const int Y_DELIMITER_HEIGHT = 60;
const int X_START_NEGATIVE_OFFSET = 40;

private IGraphSource CreatePascalTriangleGraphSource(int levels)
{
    PascalTriangleGraphSource graph = new PascalTriangleGraphSource();
    for (int i = 0; i < levels; i++)
    {
        for (int j = 0; j < i + 1; j++)
        {
            PascalNode node = new PascalNode()
            {
                Position = new Point()
                {
                    Y = ROOT_Y_Position + i * Y_DELIMITER_HEIGHT,
                    X = ROOT_X_Position - i * X_START_NEGATIVE_OFFSET + j * X_DELIMITER_WIDTH
                },
                PascalNumber = Binom(i, j)
            };
            graph.InternalItems.Add(node);
            int currIndex = i * (i + 1) / 2 + j;
            if (j == 0) graph.InternalEdges.Add(new PascalEdge() { Source = graph.InternalItems[currIndex - i], Target = node });
            if (j == i && i != 0) graph.InternalEdges.Add(new PascalEdge() { Source = graph.InternalItems[currIndex - i - 1], Target = node });
            if (0 < j && j < i)
            {
                graph.InternalEdges.Add(new PascalEdge() { Source = graph.InternalItems[currIndex - i - 1], Target = node });
                graph.InternalEdges.Add(new PascalEdge() { Source = graph.InternalItems[currIndex - i], Target = node });
            }
        }
    }
    return graph;
}

private int Binom(int n, int k)
{
    return FactN(n) / (FactN(k) * FactN(n - k));
}

private int FactN(int n)
{
    if (n == 0 || n == 1) return 1;
    int res = 1;
    for (int i = 1; i <= n; i++)
    {
        res = res * i;
    }
    return res;
}Private Const ROOT_X_Position As Integer = 400
Private Const ROOT_Y_Position As Integer = 20
Private Const X_DELIMITER_WIDTH As Integer = 80
Private Const Y_DELIMITER_HEIGHT As Integer = 60
Private Const X_START_NEGATIVE_OFFSET As Integer = 40
Private Function CreatePascalTriangleGraphSource(ByVal levels As Integer) As IGraphSource
Dim graph As New PascalTriangleGraphSource()
For i As Integer = 0 To levels - 1
For j As Integer = 0 To i
Dim node As New PascalNode() With {.Position = New Point() With {.Y = ROOT_Y_Position + i * Y_DELIMITER_HEIGHT, .X = ROOT_X_Position - i * X_START_NEGATIVE_OFFSET + j * X_DELIMITER_WIDTH}, .PascalNumber = Binom(i, j)}
graph.InternalItems.Add(node)
Dim currIndex As Integer = i * (i + 1) / 2 + j
If j = 0 Then
graph.InternalEdges.Add(New PascalEdge() With {.Source = graph.InternalItems(currIndex - i), .Target = node})
End If
If j = i AndAlso i <> 0 Then
graph.InternalEdges.Add(New PascalEdge() With {.Source = graph.InternalItems(currIndex - i - 1), .Target = node})
End If
If 0 < j AndAlso j < i Then
graph.InternalEdges.Add(New PascalEdge() With {.Source = graph.InternalItems(currIndex - i - 1), .Target = node})
graph.InternalEdges.Add(New PascalEdge() With {.Source = graph.InternalItems(currIndex - i), .Target = node})
End If
Next j
Next i
Return graph
End Function
Private Function Binom(ByVal n As Integer, ByVal k As Integer) As Integer
Return FactN(n) / (FactN(k) * FactN(n - k))
End Function
Private Function FactN(ByVal n As Integer) As Integer
If n = 0 OrElse n = 1 Then
Return 1
End If
Dim res As Integer = 1
For i As Integer = 1 To n
res = res * i
Next i
Return res
End FunctionConfiguring XAML
Now let's take care of our Shapes and Connections' look and feel. We have to bind the Shapes' Position property and define ContentTemplate to show the PascalNumber. On the other hand, we have to create an empty ContentTemplate for the Connections if we don't want the default one - the name of the ViewModel's class shown in a TextBlock. We will also define a TargetCapType for the edges.
Example 6: Declaring the RadDiagram in XAML and adding the necessary styles
<Grid x:Name="LayoutRoot">
    <Grid.Resources>
        <Style x:Key="pascalNodeStyle" TargetType="telerik:RadDiagramShape">
            <Setter Property="Position" Value="{Binding Position, Mode=TwoWay}" />
            <Setter Property="Content" Value="{Binding}" />
            <Setter Property="Geometry" Value="{telerik:CommonShape ShapeType=EllipseShape}" />
            <Setter Property="Width" Value="40" />
            <Setter Property="Height" Value="40" />
            <Setter Property="ContentTemplate">
                <Setter.Value>
                    <DataTemplate >
                        <TextBlock FontSize="14"
                                   FontWeight="Bold"
                                   Foreground="Black"
                                   Text="{Binding PascalNumber}" />
                    </DataTemplate>
                </Setter.Value>
            </Setter>
        </Style>

        <Style x:Key="pascalEdgeStyle" TargetType="telerik:RadDiagramConnection">
            <Setter Property="TargetCapType" Value="Arrow1" />
            <Setter Property="ContentTemplate">
                <Setter.Value>
                    <DataTemplate />
                </Setter.Value>
            </Setter>
        </Style>
    </Grid.Resources>

    <telerik:RadDiagram ConnectionStyle="{StaticResource pascalEdgeStyle}"
                        ShapeStyle="{StaticResource pascalNodeStyle}" />
</Grid>
Connecting The View And The ViewModel
The final step is to bind the View to the ViewModels:
Example 7: Setting the GraphSource
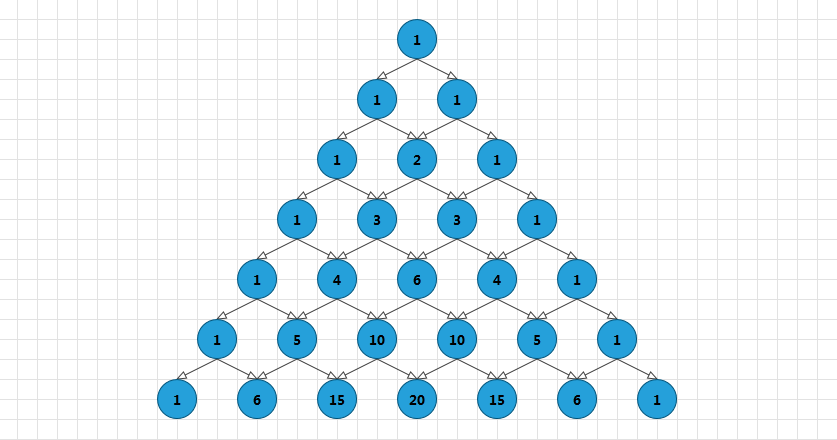
this.diagram.GraphSource = CreatePascalTriangleGraphSource(7);Me.diagram.GraphSource = CreatePascalTriangleGraphSource(7)Figure 1: Pascal Triangle with seven levels represented by RadDiagram
Two-Way MVVM
In Q2 2012 we improved the MVVM support by adding two-way changes, i.e. changes in the UI or diagram will be reflected in the viewmodel.
In order to make use of the two-way binding the data source should implement the IObservableGraphSource interface which extends the IGraphSource interface with some methods called by RadDiagram when Items are added or removed in the diagram.
The simplest way to use the IObservableGraphSource is via its default implementation in the Extensions library. The ObservableGraphSourceBase contains Add and Remove methods which can and should be overriden to make sure that any changes in the view (RadDiagram canvas), will be reflected in the ViewModel. The next examples demonstrate this in a sample scenario.
Example 8: Defining a model
public class Person : NodeViewModelBase
{
    public Person(string name)
    {
        this.Name = name;
    }

    public string Name
    {
        get
        {
            return this.Content.ToString();
        }
        set
        {
            this.Content = value;
            this.OnPropertyChanged("Name");
        }
    }

    public override string ToString()
    {
        return this.Name;
    }
}Public Class Person
Inherits NodeViewModelBase
Public Sub New(name As String)
Me.Name = name
End Sub
Public Property Name() As String
Get
Return Me.Content.ToString()
End Get
Set
Me.Content = value
Me.OnPropertyChanged("Name")
End Set
End Property
Public Overrides Function ToString() As String
Return Me.Name
End Function
End ClassNext, define a graph source deriving from the ObservableGraphSourceBase<TNode,TLink> class as in Example 9.
Example 9: Implement ObservableGraphSourceBase
public class DataStore : ObservableGraphSourceBase<NodeViewModelBase, LinkViewModelBase<NodeViewModelBase>>
{
    public DataStore()
    {
        this.AddNode(new Person("Johnny Carter"));
        this.AddNode(new Person("Alexandra Morgan"));
        this.AddNode(new Person("Jeff Kadensky"));
    }

    public override void AddNode(NodeViewModelBase node)
    {
        if (!(node is Person)) node = new Person("New Person!");
        base.AddNode(node);
    }
}Public Class DataStore
Inherits ObservableGraphSourceBase(Of NodeViewModelBase, LinkViewModelBase(Of NodeViewModelBase))
Public Sub New()
Me.AddNode(New Person("Johnny Carter"))
Me.AddNode(New Person("Alexandra Morgan"))
Me.AddNode(New Person("Jeff Kadensky"))
End Sub
Public Overrides Sub AddNode(node As NodeViewModelBase)
If Not (TypeOf node Is Person) Then
node = New Person("New Person!")
End If
MyBase.AddNode(node)
End Sub
End ClassThis model is bound to a RadTreeView and a RadDiagram in XAML as demonstrated in Example 10.
Example 10: Showing the items in a RadTreeView
<telerik:RadDiagram x:Name="diagram" GraphSource="{Binding }" />

<telerik:RadTreeView x:Name="tree" Grid.Column="1" Width="300" ItemsSource="{Binding Items}">
    <telerik:RadTreeView.ItemTemplate>
        <DataTemplate>
            <TextBlock Text="{Binding Name}" />
        </DataTemplate>
    </telerik:RadTreeView.ItemTemplate>
</telerik:RadTreeView>
Figure 2: Result from Example 10

Figure 3: Selecting an item and pasting it into the diagram
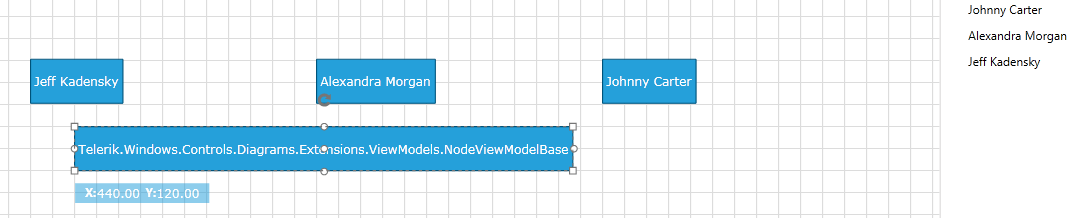
An item has been created in the MVVM model (the empty treeview item) as a result of the changes in the diagram, as should be with a two-way MVVM source. The item has however an empty content since RadDiagram has thus far no knowledge of the Person data type to insert into the model.
For this purpose you need to override the AddNode method in the Datastore as in Example 11.
Example 11: Overriding the AddNode method
public override void AddNode(NodeViewModelBase node)
{
    if (!(node is Person)) node = new Person("New Person!");
    base.AddNode(node);
}Public Overrides Sub AddNode(node As NodeViewModelBase)
If Not (TypeOf node Is Person) Then
node = New Person("New Person!")
End If
MyBase.AddNode(node)
End SubFigure 4: Result from Example 11

Clearing the Cache of the ItemContainerGenerator
When an item (node) is removed from the GraphSource, its corresponding UI container (the RadDiagramShape) is stored in a collection of 'recycled' shapes for future use. This aims to speed up the diagram's performance in extensive undo-redo and container generation operations. However, this could lead to an increased use of memory. In order to clear this cache, utilize the ClearCache method of the diagram's ContainerGenerator as demonstrated in Example 12.
Example 12: Invoking the ClearCache method of the ItemContainerGenerator
(this.diagram.ContainerGenerator as GenericContainerGenerator<Telerik.Windows.Controls.Diagrams.RadDiagramItem>).ClearCache();TryCast(Me.Diagram.ContainerGenerator, GenericContainerGenerator(Of Telerik.Windows.Controls.Diagrams.RadDiagramItem)).ClearCache()