New to Telerik UI for WinForms? Start a free 30-day trial
SparkScatterSeries
Updated on May 7, 2026
Unlike Categorical series, ScatterSeries plots its data upon two numerical axes. Scatter series identify the position of each ScatterDataPoint using two numerical values - XValue and YValue for the horizontal and vertical axes respectively, just like in the typical Cartesian coordinate system. Here is how to create two SparkScatterSeries and populate them manually:
Create SparkScatterSeries
C#
public void CreateScatterSeries()
{
    var scatterSeries = new SparkScatterSeries();
    scatterSeries.DataPoints.Add(new ScatterSparkDataPoint(13, 1));
    scatterSeries.DataPoints.Add(new ScatterSparkDataPoint(20, 2));
    scatterSeries.DataPoints.Add(new ScatterSparkDataPoint(15, 3));
    scatterSeries.DataPoints.Add(new ScatterSparkDataPoint(5, 4));
    scatterSeries.DataPoints.Add(new ScatterSparkDataPoint(29, 5));
    scatterSeries.DataPoints.Add(new ScatterSparkDataPoint(8, 6));
    scatterSeries.DataPoints.Add(new ScatterSparkDataPoint(22, 71));

    scatterSeries.ShowHighPointIndicator = true;
    scatterSeries.ShowLowPointIndicator = true;

    this.radSparkline1.Series = scatterSeries;
}
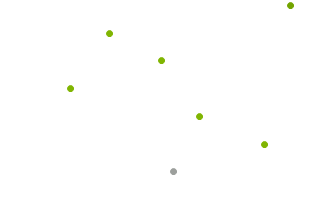
Figure 1: SparkScatterSeries
The essential properties of SparkScatterSeries are:
| Property | Description |
|---|---|
| HighValue | Gets the high value data point. |
| LowValue | Gets the low value data point. |