New to Telerik UI for WinForms? Start a free 30-day trial
CartesianFreeFigureAnnotation
Updated on May 7, 2026
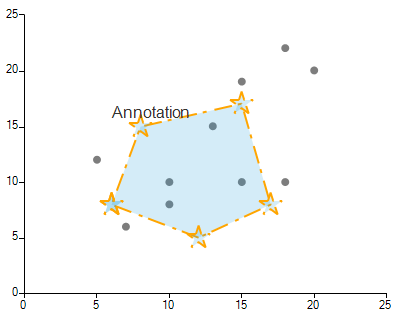
CartesianFreeFigureAnnotation allows you to add an annotation in RadChartView that is formed by a set of FreeFigurePoints. This allows you to create a free figure plotted on the view-port. Each FreeFigurePoint is defined by X and Y values.
Figure 1: CartesianFreeFigureAnnotation
Define Annotation
C#
ScatterSeries scatterSeries = new ScatterSeries();
scatterSeries.Name = "ChartData";
scatterSeries.DataPoints.Add(new ScatterDataPoint(15, 19));
scatterSeries.DataPoints.Add(new ScatterDataPoint(18, 10));
scatterSeries.DataPoints.Add(new ScatterDataPoint(13, 15));
scatterSeries.DataPoints.Add(new ScatterDataPoint(10, 8));
scatterSeries.DataPoints.Add(new ScatterDataPoint(5, 12));
scatterSeries.DataPoints.Add(new ScatterDataPoint(20, 20));
scatterSeries.DataPoints.Add(new ScatterDataPoint(15, 10));
scatterSeries.DataPoints.Add(new ScatterDataPoint(7, 6));
scatterSeries.DataPoints.Add(new ScatterDataPoint(18, 22));
scatterSeries.DataPoints.Add(new ScatterDataPoint(10, 10));
scatterSeries.PointSize = new SizeF(8, 8);
this.radChartView1.Series.Add(scatterSeries);

CartesianFreeFigureAnnotation freeAnnotation = new CartesianFreeFigureAnnotation();
freeAnnotation.Points.Add(new FreeFigurePoint(6, 8));
freeAnnotation.Points.Add(new FreeFigurePoint(8, 15));
freeAnnotation.Points.Add(new FreeFigurePoint(15, 17));
freeAnnotation.Points.Add(new FreeFigurePoint(17, 8));
freeAnnotation.Points.Add(new FreeFigurePoint(12, 5));
freeAnnotation.Points.Add(new FreeFigurePoint(6, 8));

freeAnnotation.CloseFigure = true;
freeAnnotation.Spline = false;
freeAnnotation.Label = "Annotation";
freeAnnotation.Font = new Font("Arial", 12f, FontStyle.Regular);
freeAnnotation.BackColor = Color.FromArgb(50, 37, 160, 219);
freeAnnotation.BorderDashStyle = DashStyle.Custom;
freeAnnotation.BorderDashPattern = new float[] { 9, 3, 2, 4 };
freeAnnotation.BorderColor = Color.Orange;
freeAnnotation.BorderWidth = 2;

freeAnnotation.PointShape = new StarShape();
freeAnnotation.PointSize = new SizeF(24, 24);
this.radChartView1.Annotations.Add(freeAnnotation);
Properties
| Property | Description |
|---|---|
| Label | Gets or sets the label. |
| PointSize | Gets or sets the point size. |
| PointShape | Gets or sets the point shape. |
| Points | Gets the collection of data points. |
| CloseFigure | Determines whether the figure will be closed by connecting a line from the endpoint to the starting point. |
| Spline | Gets or sets a value indicating whether the annotation will be drawn as a spline. |
| SplineTension | Gets or sets a value indicating the tension of the spline. Spline property must be set to true for this property to have effect. |
| PositonOffset | Allows you to specify the offset for the label. |