or
8 answers
174 views
Hi all,
I have a property grid which is populated when an item in a tree view is selected.
The appropriate description appears when you click a property in the grid. However, when a new item in the tree view is selected, although the new set of properties is loaded up the old description remains.
I need to be able to clear this when I click on a new item in my tree view
Thanks is advance
Arthur

Maya
Telerik team

answered
on
13 May 2013
0 answers
342 views
Hi I am using the busy indicator while I have a simulator setting it self up. I need to give the user a method to perform an emergency stop if needed. I tried adding a button to the data template but clicking it seems to do nothing. Can this be done? Below is the XMAL and command definition
.
<telerik:RadBusyIndicator IsIndeterminate="True" IsBusy="{Binding IsVehicleRotating}"> <telerik:RadBusyIndicator.BusyContentTemplate> <DataTemplate> <Grid HorizontalAlignment="Center" VerticalAlignment="Center"> <Grid.RowDefinitions> <RowDefinition></RowDefinition> <RowDefinition Height="23"></RowDefinition> </Grid.RowDefinitions> <diControls:DILabel> Vehicle is rotating </diControls:DILabel> <diControls:DIButton Grid.Row="1"> Emergency Stop </diControls:DIButton> </Grid> </DataTemplate> </telerik:RadBusyIndicator.BusyContentTemplate><!--Content is here--> </telerik:RadBusyIndicator>private RelayCommand emergencyStopCommand; public RelayCommand EmergencyStopCommand { get { return emergencyStopCommand ?? (emergencyStopCommand = new RelayCommand(() => { IsVehicleRotating = false; vehicleStateController.EmergencyStop(); Cleanup(); } )); } }
Josh
Top achievements
 Rank 1
asked
on
13 May 2013
1 answer
96 views
So I have a basic DataFormatString based on columns but there will be rows that are a exception (they show percentage between the other rows) and I need to format those rows as a percentage number.
I've took a look into both Row- and CellStyleSelector and CellTemplateSelector but not sure any of these can do the trick because they don't seem to manage the DataFormatString.
RowStyle with <Setter Property="ContentStringFormat" Value="P" /> does nothing, probably because he tries to apply that to the whole row which of course is not a string.
Dimitrina
Telerik team
answered
on
13 May 2013
1 answer
91 views
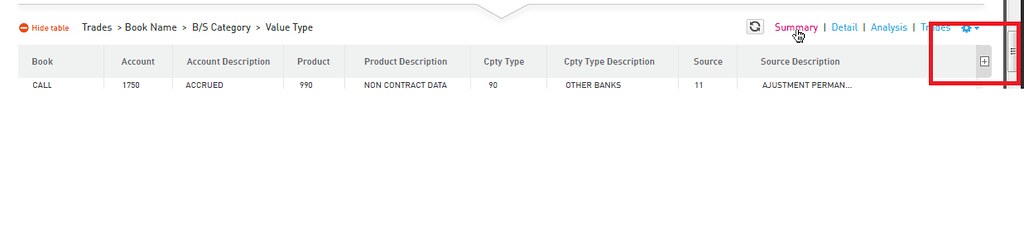
I want to add a button to the right of the last column, can this be done?
The following link shows an image with the button highlighted:
http://farm8.staticflickr.com/7306/8734034759_4e632a1cb0_b.jpg
The following link shows an image with the button highlighted:
http://farm8.staticflickr.com/7306/8734034759_4e632a1cb0_b.jpg
Pavel Pavlov
Telerik team
answered
on
13 May 2013
5 answers
364 views
HI,
My grid view contains number of rows and one column in the grid view contains a list box.
I am using the below code to change the color of textblock placed inside the list box based on its parent grid view row.
Though its working fine but i want one more condition in this trigger to check wheather Parent grid view selected row's selection is active or not.For that i modified condition inside the trigger as mentioned below:
<MultiDataTrigger>
<Condition Binding="{Binding RelativeSource={RelativeSource Mode=FindAncestor, AncestorType={x:Type telerik:GridViewRow}}, Path=IsSelected}" Value="true"/>
<Condition Binding="{Binding RelativeSource={RelativeSource Mode=FindAncestor, AncestorType={x:Type telerik:GridViewRow}}, Path=Selector.IsSelectionActive}" Value="true"/>
</MultiDataTrigger>
But its not working. Can you please suggest which approach to use to get parent row's Selector.IsSelectionActive property.
Looking forward for your reply.
Thanks And Regards,
Kavita
My grid view contains number of rows and one column in the grid view contains a list box.
I am using the below code to change the color of textblock placed inside the list box based on its parent grid view row.
<Style TargetType="{x:Type TextBlock}" BasedOn="{StaticResource {x:Type TextBlock}}">
<Style.Triggers>
<DataTrigger Binding="{Binding RelativeSource={RelativeSource Mode=FindAncestor, AncestorType={x:Type telerik:GridViewRow}}, Path=IsSelected}" Value="True">
<Setter Property="Foreground" Value="White" />
</DataTrigger>
</Style.Triggers>
</Style>
Though its working fine but i want one more condition in this trigger to check wheather Parent grid view selected row's selection is active or not.For that i modified condition inside the trigger as mentioned below:
<MultiDataTrigger>
<Condition Binding="{Binding RelativeSource={RelativeSource Mode=FindAncestor, AncestorType={x:Type telerik:GridViewRow}}, Path=IsSelected}" Value="true"/>
<Condition Binding="{Binding RelativeSource={RelativeSource Mode=FindAncestor, AncestorType={x:Type telerik:GridViewRow}}, Path=Selector.IsSelectionActive}" Value="true"/>
</MultiDataTrigger>
But its not working. Can you please suggest which approach to use to get parent row's Selector.IsSelectionActive property.
Looking forward for your reply.
Thanks And Regards,
Kavita
Pavel Pavlov
Telerik team
answered
on
13 May 2013
1 answer
200 views
Hey there,
I'm pretty new with the ribbonview but i'm very confused with those 2 sub components, both seem to be pretty much the same thing to me (click on the topleft button, opens a zone).
What differenciates them? Which one should i use in which case? Can and should both be used?
I did look at the doc and manage to use both, but i really don't see where they differ in functional use.
Pavel R. Pavlov
Telerik team
answered
on
13 May 2013
3 answers
195 views
hi, can this control can be modified to enable to draw ink on the imported image? such as, InkCanvas
Petya
Telerik team
answered
on
13 May 2013
5 answers
519 views
Hello,
I was wondering if there exists some option to customize the values of the Y axis when using bar series with combined mode stack or some option for stack mode to plot to corresponding points of Y axes. If I understood well when a bar series is in Stack mode the bar ignores the real values but it plots the distance between points in the series, putting all the portions one above another and create an enormous scale for the Y axis. I would like if possible that it takes the real values, cause they are sequential in my example, and make the correct scale with real values.
I will explain my problem, so maybe you can give me an advice, maybe there is some other component or chart option, different series that I can use to solve my problem. I am using MVVM pattern and as I am not verry profound of code behind and would like to solve this problem in MVVM style.
So I have a list of strands and each strand is divided in n zones that have start position, end position and a quality indicator. In base of this quality indicator each zone is colored with the specific color. The values of the start and end position are sequential, so that each point rappresents a single zone and i single colored portion on the stack bar. My idea was to create an collection of QcsStrandData in my viewmodel, and bind this collection to the item source of the bar series in the cartesian chart, setting the categoryBinding = "StrandNo" and ValueBinding = "ZoneEnd", in that way I achieved to have a single bar for each strand divided in the corresponding zones. I managed to color the zone portions using the point Template and until here everything is perfect. The problem is that in this way the Y axes goes to the stars and not to the maximum value of the last point. I also manage somehow to bypass that, I defined and internal vertical ax inside the bar series and hide it, and used the general Y ax and bind it to a fixed maximum value. But then I noticed another problem that I miss the proportions, cause the portion on the bar is in proportion of distance between 2 points, so for example I have one zone from 4640 to 7920, the next one 7920 to 17115, the next from 17115 to 18215 but the height on the bar of all of this zones is the same and I would need it to be in proportion with the real values.
The structure of the entity is
The part of the viewModel that fills the collection is
and the xaml code for the chart
I also attach 2 jpgs wpfStrandZones with the result that I obtain with the source code above and the strandZones that is the screen of what I would need to have.
Any suggestion would be appreciated.
Thanks
I was wondering if there exists some option to customize the values of the Y axis when using bar series with combined mode stack or some option for stack mode to plot to corresponding points of Y axes. If I understood well when a bar series is in Stack mode the bar ignores the real values but it plots the distance between points in the series, putting all the portions one above another and create an enormous scale for the Y axis. I would like if possible that it takes the real values, cause they are sequential in my example, and make the correct scale with real values.
I will explain my problem, so maybe you can give me an advice, maybe there is some other component or chart option, different series that I can use to solve my problem. I am using MVVM pattern and as I am not verry profound of code behind and would like to solve this problem in MVVM style.
So I have a list of strands and each strand is divided in n zones that have start position, end position and a quality indicator. In base of this quality indicator each zone is colored with the specific color. The values of the start and end position are sequential, so that each point rappresents a single zone and i single colored portion on the stack bar. My idea was to create an collection of QcsStrandData in my viewmodel, and bind this collection to the item source of the bar series in the cartesian chart, setting the categoryBinding = "StrandNo" and ValueBinding = "ZoneEnd", in that way I achieved to have a single bar for each strand divided in the corresponding zones. I managed to color the zone portions using the point Template and until here everything is perfect. The problem is that in this way the Y axes goes to the stars and not to the maximum value of the last point. I also manage somehow to bypass that, I defined and internal vertical ax inside the bar series and hide it, and used the general Y ax and bind it to a fixed maximum value. But then I noticed another problem that I miss the proportions, cause the portion on the bar is in proportion of distance between 2 points, so for example I have one zone from 4640 to 7920, the next one 7920 to 17115, the next from 17115 to 18215 but the height on the bar of all of this zones is the same and I would need it to be in proportion with the real values.
The structure of the entity is
public class QcsStrandData : BaseObject { private long stranNo; public long StrandNo { get { return this.stranNo; } set { this.stranNo = value; this.OnPropertyChanged("StrandNo"); } } private double zoneEnd; public double ZoneEnd { get { return this.zoneEnd; } set { this.zoneEnd = value; this.OnPropertyChanged("ZoneEnd"); } } private double zoneStart; public double ZoneStart { get { return zoneStart; } set { zoneStart = value; this.OnPropertyChanged("ZoneStart"); } } private Brush zoneQuality; public Brush ZoneQuality { get { return this.zoneQuality; } set { this.zoneQuality = value; this.OnPropertyChanged("ZoneQuality"); } } private string zoneName; public string ZoneName { get { return zoneName; } set { zoneName = value; this.OnPropertyChanged("ZoneName"); } } }public ObservableCollection<QcsStrandData> QcsData { get { return qcsData; } set { qcsData = value; this.OnPropertyChanged("QcsData"); } } public ObservableCollection<QcsStrandData> CreateQcsStrandsData() { ObservableCollection<QcsStrandData> result = new ObservableCollection<QcsStrandData>(); result.Add(new QcsStrandData() { ZoneName = "Tundish", StrandNo = 1, ZoneEnd = 100, ZoneQuality = new SolidColorBrush(Colors.Red) }); result.Add(new QcsStrandData() { ZoneName = "Mould", StrandNo = 1, ZoneEnd = 680, ZoneQuality = new SolidColorBrush(Colors.Orange) }); result.Add(new QcsStrandData() { ZoneName = "Zone 1", StrandNo = 1, ZoneEnd = 980, ZoneQuality = new SolidColorBrush(Colors.Lime) }); result.Add(new QcsStrandData() { ZoneName = "Zone 2", StrandNo = 1, ZoneEnd = 2830, ZoneQuality = new SolidColorBrush(Colors.Lime) }); result.Add(new QcsStrandData() { ZoneName = "Zone 3", StrandNo = 1, ZoneEnd = 4640, ZoneQuality = new SolidColorBrush(Colors.Lime) }); result.Add(new QcsStrandData() { ZoneName = "Zone 4", StrandNo = 1, ZoneEnd = 7920, ZoneQuality = new SolidColorBrush(Colors.Lime) }); result.Add(new QcsStrandData() { ZoneName = "AirCooling", StrandNo = 1, ZoneEnd = 17115, ZoneQuality = new SolidColorBrush(Colors.Orange) }); result.Add(new QcsStrandData() { ZoneName = "Module1", StrandNo = 1, ZoneEnd = 18215, ZoneQuality = new SolidColorBrush(Colors.Red) }); result.Add(new QcsStrandData() { ZoneName = "Module2", StrandNo = 1, ZoneEnd = 19315, ZoneQuality = new SolidColorBrush(Colors.Lime) }); result.Add(new QcsStrandData() { ZoneName = "Module3", StrandNo = 1, ZoneEnd = 20415, ZoneQuality = new SolidColorBrush(Colors.Red) }); result.Add(new QcsStrandData() { ZoneName = "Module4", StrandNo = 1, ZoneEnd = 21515, ZoneQuality = new SolidColorBrush(Colors.Orange) }); result.Add(new QcsStrandData() { ZoneName = "Module5", StrandNo = 1, ZoneEnd = 22615, ZoneQuality = new SolidColorBrush(Colors.Red) }); result.Add(new QcsStrandData() { ZoneName = "Module6", StrandNo = 1, ZoneEnd = 23715, ZoneQuality = new SolidColorBrush(Colors.Red) }); result.Add(new QcsStrandData() { ZoneName = "Module7", StrandNo = 1, ZoneEnd = 24815, ZoneQuality = new SolidColorBrush(Colors.Lime) }); result.Add(new QcsStrandData() { ZoneName = "Module8", StrandNo = 1, ZoneEnd = 25915, ZoneQuality = new SolidColorBrush(Colors.OrangeRed) }); result.Add(new QcsStrandData() { ZoneName = "Module9", StrandNo = 1, ZoneEnd = 27015, ZoneQuality = new SolidColorBrush(Colors.Red) }); result.Add(new QcsStrandData() { ZoneName = "Tart", StrandNo = 1, ZoneEnd = 37395, ZoneQuality = new SolidColorBrush(Colors.Lime) }); result.Add(new QcsStrandData() { ZoneName = "Tcm", StrandNo = 1, ZoneEnd = 46500, ZoneQuality = new SolidColorBrush(Colors.Lime) }); result.Add(new QcsStrandData() { ZoneName = "Tundish", StrandNo = 2, ZoneEnd = 100, ZoneQuality = new SolidColorBrush(Colors.Red) }); result.Add(new QcsStrandData() { ZoneName = "Mould", StrandNo = 2, ZoneEnd = 680, ZoneQuality = new SolidColorBrush(Colors.Orange) }); result.Add(new QcsStrandData() { ZoneName = "Zone 1", StrandNo = 2, ZoneEnd = 980, ZoneQuality = new SolidColorBrush(Colors.Lime) }); result.Add(new QcsStrandData() { ZoneName = "Zone 2", StrandNo = 2, ZoneEnd = 2830, ZoneQuality = new SolidColorBrush(Colors.Lime) }); result.Add(new QcsStrandData() { ZoneName = "Zone 3", StrandNo = 2, ZoneEnd = 4640, ZoneQuality = new SolidColorBrush(Colors.Lime) }); result.Add(new QcsStrandData() { ZoneName = "Zone 4", StrandNo = 2, ZoneEnd = 7920, ZoneQuality = new SolidColorBrush(Colors.Lime) }); result.Add(new QcsStrandData() { ZoneName = "AirCooling", StrandNo = 2, ZoneEnd = 17115, ZoneQuality = new SolidColorBrush(Colors.Orange) }); result.Add(new QcsStrandData() { ZoneName = "Module1", StrandNo = 2, ZoneEnd = 18215, ZoneQuality = new SolidColorBrush(Colors.Red) }); result.Add(new QcsStrandData() { ZoneName = "Module2", StrandNo = 2, ZoneEnd = 19315, ZoneQuality = new SolidColorBrush(Colors.Lime) }); result.Add(new QcsStrandData() { ZoneName = "Module3", StrandNo = 2, ZoneEnd = 20415, ZoneQuality = new SolidColorBrush(Colors.Red) }); result.Add(new QcsStrandData() { ZoneName = "Module4", StrandNo = 2, ZoneEnd = 21515, ZoneQuality = new SolidColorBrush(Colors.Orange) }); result.Add(new QcsStrandData() { ZoneName = "Module5", StrandNo = 2, ZoneEnd = 22615, ZoneQuality = new SolidColorBrush(Colors.Red) }); result.Add(new QcsStrandData() { ZoneName = "Module6", StrandNo = 2, ZoneEnd = 23715, ZoneQuality = new SolidColorBrush(Colors.Red) }); result.Add(new QcsStrandData() { ZoneName = "Module7", StrandNo = 2, ZoneEnd = 24815, ZoneQuality = new SolidColorBrush(Colors.Lime) }); result.Add(new QcsStrandData() { ZoneName = "Module8", StrandNo = 2, ZoneEnd = 25915, ZoneQuality = new SolidColorBrush(Colors.OrangeRed) }); result.Add(new QcsStrandData() { ZoneName = "Module9", StrandNo = 2, ZoneEnd = 27015, ZoneQuality = new SolidColorBrush(Colors.Red) }); result.Add(new QcsStrandData() { ZoneName = "Tart", StrandNo = 2, ZoneEnd = 37395, ZoneQuality = new SolidColorBrush(Colors.Lime) }); result.Add(new QcsStrandData() { ZoneName = "Tcm", StrandNo = 2, ZoneEnd = 46500, ZoneQuality = new SolidColorBrush(Colors.Lime) }); result.Add(new QcsStrandData() { ZoneName = "Tundish", StrandNo = 3, ZoneEnd = 100, ZoneQuality = new SolidColorBrush(Colors.Red) }); result.Add(new QcsStrandData() { ZoneName = "Mould", StrandNo = 3, ZoneEnd = 680, ZoneQuality = new SolidColorBrush(Colors.Orange) }); result.Add(new QcsStrandData() { ZoneName = "Zone 1", StrandNo = 3, ZoneEnd = 980, ZoneQuality = new SolidColorBrush(Colors.Lime) }); result.Add(new QcsStrandData() { ZoneName = "Zone 2", StrandNo = 3, ZoneEnd = 2830, ZoneQuality = new SolidColorBrush(Colors.Lime) }); result.Add(new QcsStrandData() { ZoneName = "Zone 3", StrandNo = 3, ZoneEnd = 4640, ZoneQuality = new SolidColorBrush(Colors.Lime) }); result.Add(new QcsStrandData() { ZoneName = "Zone 4", StrandNo = 3, ZoneEnd = 7920, ZoneQuality = new SolidColorBrush(Colors.Lime) }); result.Add(new QcsStrandData() { ZoneName = "AirCooling", StrandNo = 3, ZoneEnd = 17115, ZoneQuality = new SolidColorBrush(Colors.Orange) }); result.Add(new QcsStrandData() { ZoneName = "Module1", StrandNo = 3, ZoneEnd = 18215, ZoneQuality = new SolidColorBrush(Colors.Red) }); result.Add(new QcsStrandData() { ZoneName = "Module2", StrandNo = 3, ZoneEnd = 19315, ZoneQuality = new SolidColorBrush(Colors.Lime) }); result.Add(new QcsStrandData() { ZoneName = "Module3", StrandNo = 3, ZoneEnd = 20415, ZoneQuality = new SolidColorBrush(Colors.Red) }); result.Add(new QcsStrandData() { ZoneName = "Module4", StrandNo = 3, ZoneEnd = 21515, ZoneQuality = new SolidColorBrush(Colors.Orange) }); result.Add(new QcsStrandData() { ZoneName = "Module5", StrandNo = 3, ZoneEnd = 22615, ZoneQuality = new SolidColorBrush(Colors.Red) }); result.Add(new QcsStrandData() { ZoneName = "Module6", StrandNo = 3, ZoneEnd = 23715, ZoneQuality = new SolidColorBrush(Colors.Red) }); result.Add(new QcsStrandData() { ZoneName = "Module7", StrandNo = 3, ZoneEnd = 24815, ZoneQuality = new SolidColorBrush(Colors.Lime) }); result.Add(new QcsStrandData() { ZoneName = "Module8", StrandNo = 3, ZoneEnd = 25915, ZoneQuality = new SolidColorBrush(Colors.OrangeRed) }); result.Add(new QcsStrandData() { ZoneName = "Module9", StrandNo = 3, ZoneEnd = 27015, ZoneQuality = new SolidColorBrush(Colors.Red) }); result.Add(new QcsStrandData() { ZoneName = "Tart", StrandNo = 3, ZoneEnd = 37395, ZoneQuality = new SolidColorBrush(Colors.Lime) }); result.Add(new QcsStrandData() { ZoneName = "Tcm", StrandNo = 3, ZoneEnd = 46500, ZoneQuality = new SolidColorBrush(Colors.Lime) }); return result; }<telerik:RadCartesianChart x:Name="chart" Margin="5"> <telerik:RadCartesianChart.Grid> <chartView:CartesianChartGrid MajorLinesVisibility="Y" MajorYLineDashArray="5,5" /> </telerik:RadCartesianChart.Grid> <telerik:RadCartesianChart.VerticalAxis> <chartView:LinearAxis Visibility="Visible" ShowLabels="True" Title="Distance [mm]" Minimum="0" IsInverse="True"/> </telerik:RadCartesianChart.VerticalAxis> <telerik:RadCartesianChart.HorizontalAxis> <chartView:CategoricalAxis ShowLabels="True" VerticalLocation="Top" Title="Strand" PlotMode="BetweenTicks" GapLength="{Binding StrandGap}"/> </telerik:RadCartesianChart.HorizontalAxis> <telerik:RadCartesianChart.Series> <chartView:BarSeries CategoryBinding="StrandNo" ValueBinding="ZoneEnd" ItemsSource="{Binding QcsData}" CombineMode="Stack"> <chartView:BarSeries.PointTemplate> <DataTemplate> <Border Background="{Binding DataItem.ZoneQuality}" BorderThickness="0,2,0,0" BorderBrush="Black"/> </DataTemplate> </chartView:BarSeries.PointTemplate> </chartView:BarSeries> </telerik:RadCartesianChart.Series> </telerik:RadCartesianChart>Any suggestion would be appreciated.
Thanks
1 answer
82 views
Hi,
i want to open a RadWindow with an AutoCompleteBox on it. When i get back to my user control i want
to read the Searchtext from the AutoCompletexBox! I can't find an example or something helpful.
Thanks
Best Regards
Rene
i want to open a RadWindow with an AutoCompleteBox on it. When i get back to my user control i want
to read the Searchtext from the AutoCompletexBox! I can't find an example or something helpful.
Thanks
Best Regards
Rene
Yana
Telerik team
answered
on
13 May 2013
2 answers
156 views
I'm finding rather large inconsistencies with MergeField formatting. I am binding my RichTextBox with the DocxDataProvider. On a "save" I am saving the byte[] data to a database. Sometimes the MergeFields formatting saves, other times it does not. I am noticing if there are two MergeFields right next to each other, separated by a space, the MergeField on the right will not have it's formatting saved.
The same holds true if you have a 2 column table, the MergeFields in the left column preserve their formatting, however the ones in the right do not. Though this is not an all the time thing.
Is DocxDataProvider and saving the byte[] data that unreliable? Is there a more reliable way to do things. I've wasted a lot of time playing with this, and it was a great idea to help contain our client's from making mistakes/misspellings in Word.
I'm to the worn-down phase now and will consider taking this away from the DocxDataProvider and the MVVM pattern, if i can get more reliability.
Mihail
Telerik team
answered
on
13 May 2013


