Hello,
In telerik chart control, when I reduce the size of window, axis lines are getting blur. See image for more details.
I have marked that area by red color border for better understanding. Below image shows the example of the type of Line which should be actually.
Thanks in advance.
Maulik Suchak
In telerik chart control, when I reduce the size of window, axis lines are getting blur. See image for more details.
I have marked that area by red color border for better understanding. Below image shows the example of the type of Line which should be actually.
Thanks in advance.
Maulik Suchak
8 Answers, 1 is accepted
0
Accepted

Hi Maulik,
Indeed, such blurring happens. The cause of the problem is actually a bug in the WPF framework, when the chart is nested in a more complex layout and the width of the xAxis is 1px. Presently, the framework does not allow a stable fix. If a snapping or clipping is used, there are some specific cases when the axis disappears. That is why we made some additional modifications to the control - they ensure that the xAxis is always visible - in some cases it may be slightly blurred, but it will be always visible. At present, there is no other option to handle this, or work around this bug in the framework.
Kind regards,
Sia
the Telerik team
Explore the entire Telerik portfolio by downloading the Ultimate Collection trial package. Get it now >>
0

Maulik
Top achievements
 Rank 1
answered on 08 Nov 2011, 09:43 AM
Thank you very much Sia for your ans!
0
Maulik
Top achievements
Rank 1
answered on 09 Nov 2011, 01:10 PM
Hello Sia,
Its okay with that problem,
I am having another problem in the 3D pie chart.
Please consider below image:
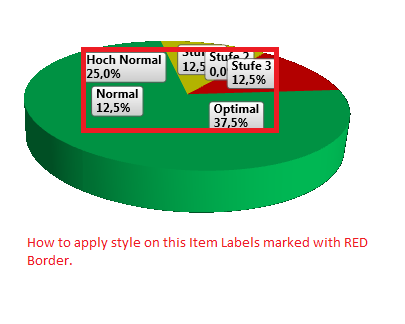
In the above chart the RED border lables style is not applying.
Please show me a direction.
Thank you in Advance.
Maulik
Its okay with that problem,
I am having another problem in the 3D pie chart.
Please consider below image:
In the above chart the RED border lables style is not applying.
Please show me a direction.
Thank you in Advance.
Maulik
0
Dhaval patel
Top achievements
Rank 1
answered on 10 Nov 2011, 06:14 AM
Hello,
i also facing same problem.
one another question: In this series, three type has same green color.
1. Hoch Normal, 2. Normal, 3. Optimal
so, is there any way to black border to distinguish them?
Thanks..
i also facing same problem.
one another question: In this series, three type has same green color.
1. Hoch Normal, 2. Normal, 3. Optimal
so, is there any way to black border to distinguish them?
Thanks..
0
Hello Maulik,
Please use the chart area style from the attached file and apply it as custom style, or just use the custom template and use the exposed Template3D property of the ChartArea.
Regards,
Sia
the Telerik team
Please use the chart area style from the attached file and apply it as custom style, or just use the custom template and use the exposed Template3D property of the ChartArea.
Regards,
Sia
the Telerik team
Explore the entire Telerik portfolio by downloading the Ultimate Collection trial package. Get it now >>
0
Hello Dhaval Patel,
Can you please send us a picture showing us what needs to be achieved?
All the best,
Sia
the Telerik team
Can you please send us a picture showing us what needs to be achieved?
All the best,
Sia
the Telerik team
Explore the entire Telerik portfolio by downloading the Ultimate Collection trial package. Get it now >>
0
Dhaval patel
Top achievements
Rank 1
answered on 15 Nov 2011, 06:34 AM
Hello,
in my chart, there are three items having same green color as shown below.

I want to distinguish all area. i can make changes in paint as i want.
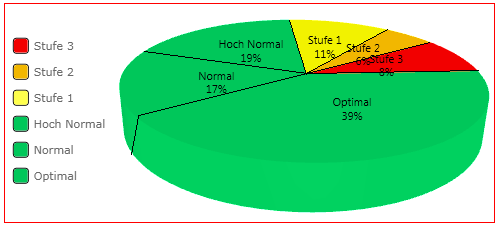
please give me solution.
thanks.
in my chart, there are three items having same green color as shown below.
I want to distinguish all area. i can make changes in paint as i want.
please give me solution.
thanks.
0
Hello Dhaval Patel,
Unfortunately this is not possible with the current implementation of our 3D RadChart.
Best wishes,
Sia
the Telerik team
Unfortunately this is not possible with the current implementation of our 3D RadChart.
Best wishes,
Sia
the Telerik team
Explore the entire Telerik portfolio by downloading the Ultimate Collection trial package. Get it now >>