
I'm programmatically adding multiple series to a chart where the categories represent yearly values. For each series the yearly values will be sequential, but not all series will contain all of the years.
e.g.
series 1: 2015, 2016, 2017
series 2: 2014, 2015, 2016
so when I add them to the chart, I will end up with 2015, 2016, 2017, 2014.
I know the overall year range in advance, and I would like to be able to manually add the "year" categories to the axis. I found a categories property on the categorical axis but does not appear to be any way to manipulate it.
3 Answers, 1 is accepted
0


Hi Steve,
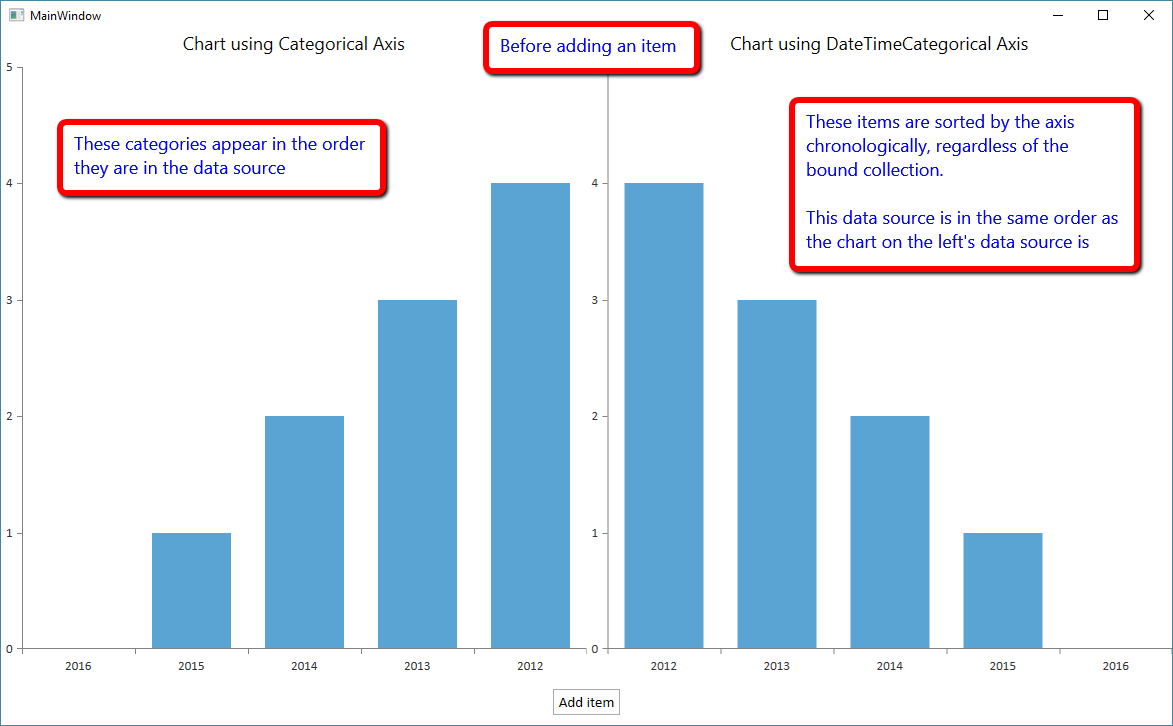
The CategoricalAxis uses the series's bound data source to determine the categories to use on the axis (using the property you've set as the series CategoryBinding). It also displays those categories in the order that they are in the bound collection.
If you wanted to have the categories appear in a particular order, you can reorder the bound collection's items and the axis will update accordingly.
Important Note: if your series ItemsSource is bound to a type with item observability, like ObservableCollection<T>, the chart will update as the items change (as seen in my demo). However, if you're using something without observability, like List<T>, you'll need to reset the ItemsSource after sorting.
Alternative
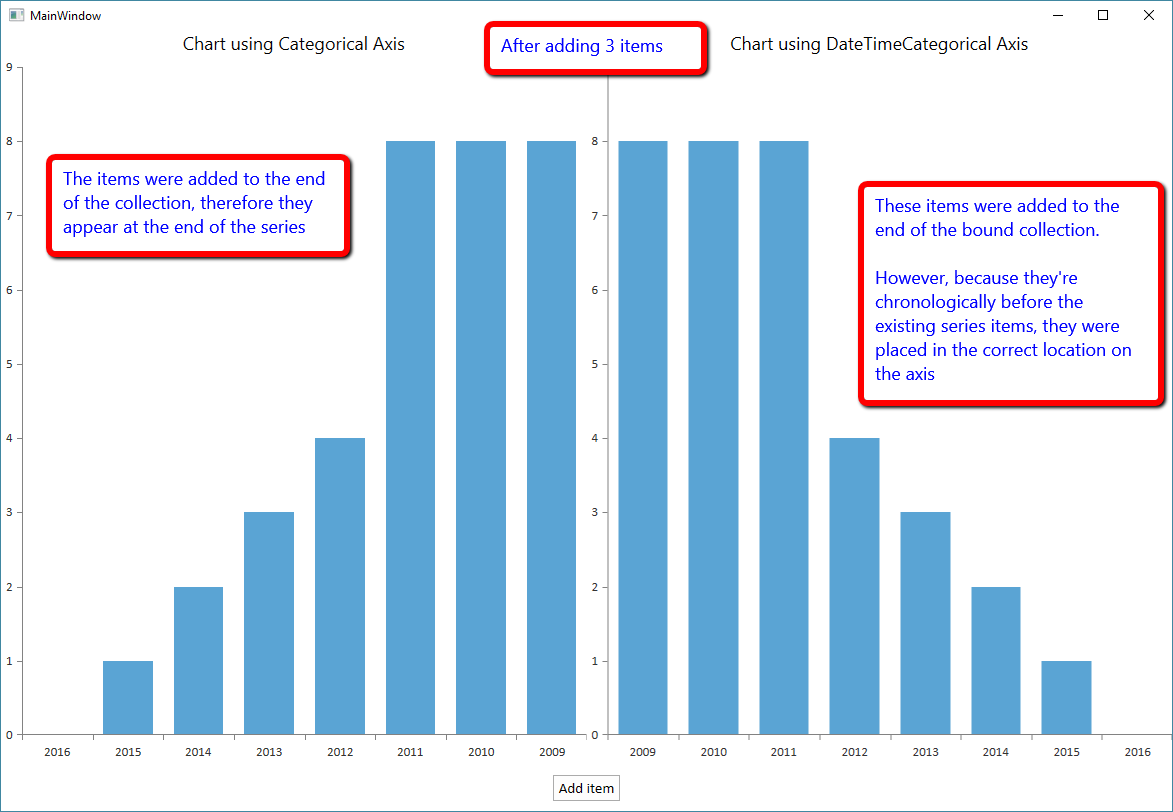
There is another option you can use, the DateTimeCategoricalAxis. With this axis type, it understands the order of the dates and will arrange them in order no matter what order they appear in the bound collection.
To demonstrate this, I've attached a demo app (run the upgrade wizard to restore the Telerik DLLs or update the references manually).
The Chart on the left, ChartOne, is using a model where the category binding is plain string with the "YYYY" as the category:
The Chart on the right, ChartTwo, is using a DateTime as the category, but I set the LabelFormat to only show the YYYY as the label:
Underneath the charts you'll see a button, AddItemButton. Clicking it will add a new item to the chart's data sources. You'll see the charts update in real time and demonstrate how the different Axis types handle the data.
Here's a before and after adding items screenshot:
BEFORE
AFTER
Summary
The takeaway is that you can do one of two things to accomplish what you want:
1 - Sort the data in the bound collection so that it is added to the series in the order you want
2 - Use a DateTimeCategoricalAxis and let the Axis handle the sorting automatically
Please let us know if you have any further questions. Thank you for contacting Support and for choosing Telerik by Progress.
Regards,
Lance | Tech Support Engineer, Sr.
Telerik by Progress
The CategoricalAxis uses the series's bound data source to determine the categories to use on the axis (using the property you've set as the series CategoryBinding). It also displays those categories in the order that they are in the bound collection.
If you wanted to have the categories appear in a particular order, you can reorder the bound collection's items and the axis will update accordingly.
Important Note: if your series ItemsSource is bound to a type with item observability, like ObservableCollection<T>, the chart will update as the items change (as seen in my demo). However, if you're using something without observability, like List<T>, you'll need to reset the ItemsSource after sorting.
Alternative
There is another option you can use, the DateTimeCategoricalAxis. With this axis type, it understands the order of the dates and will arrange them in order no matter what order they appear in the bound collection.
To demonstrate this, I've attached a demo app (run the upgrade wizard to restore the Telerik DLLs or update the references manually).
The Chart on the left, ChartOne, is using a model where the category binding is plain string with the "YYYY" as the category:
<telerik:CategoricalAxis />The Chart on the right, ChartTwo, is using a DateTime as the category, but I set the LabelFormat to only show the YYYY as the label:
<telerik:DateTimeCategoricalAxis LabelFormat="yyyy"/>Underneath the charts you'll see a button, AddItemButton. Clicking it will add a new item to the chart's data sources. You'll see the charts update in real time and demonstrate how the different Axis types handle the data.
Here's a before and after adding items screenshot:
BEFORE
AFTER
Summary
The takeaway is that you can do one of two things to accomplish what you want:
1 - Sort the data in the bound collection so that it is added to the series in the order you want
2 - Use a DateTimeCategoricalAxis and let the Axis handle the sorting automatically
Please let us know if you have any further questions. Thank you for contacting Support and for choosing Telerik by Progress.
Regards,
Lance | Tech Support Engineer, Sr.
Telerik by Progress
Do you need help with upgrading your WPF project? Try the Telerik API Analyzer and share your thoughts!
0

Nathan
Top achievements
 Rank 1
answered on 14 Jun 2018, 07:45 PM
Raising this from the dead, but is there a way to remove points from the datasource without removing the category? We're implementing a filtering functionality and we'd like some points to disappear without removing the category that they're associated with.
0
Hello Nathan,
Yes, this is an oldie, but I get notified when there are replies! Okay, let's get right to your question.
The series will won't keep a category around if there isn't a corresponding item in the ItemsSource and there's no Chart API for a static list of categories.
However, there is a trick you could use that might achieve the visual result you want: Keep a "dummy" item, with no value, as a placeholder in the collection. This way the Axis will still need to render a tick for the category but not show any value for that category.
This will likely take a little finagling to get right because you'll need to keep a reference list of all the categories you want to have visible, then after the filtering is complete find out the missing category and add that item. Then, when the filtering is removed, be sure to remove that dummy item.
I hope this helps!
Regards,
Lance | Tech Support Engineer, Sr.
Progress Telerik
Want to extend the target reach of your WPF applications, leveraging iOS, Android, and UWP? Try UI for Xamarin, a suite of polished and feature-rich components for the Xamarin framework, which allow you to write beautiful native mobile apps using a single shared C# codebase.