
would like to check if the following chart layout is possbile for Kendo Bar chart?
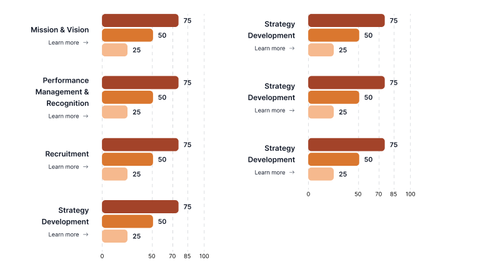
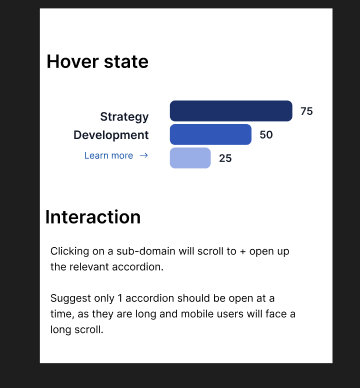
and also i would like to have an onHover event that will change the chart color. for example if i hover on the category or chart for Strategy Development to change its color to like this
1 Answer, 1 is accepted

Hi Benjamin,
Kendo UI for jQuery Bar Charts allow you to customize series colors and chart backgrounds. You can set a specific color for each series or category using the series.color option. The chart area background can also be customized with a single color or gradient using the chartArea.background property.
Here is such Dojo example - https://dojo.telerik.com/SyoZMDqx.
Regarding changing the color when a bar is hovered, you can use the series.highlight.visual. Below is an example:
highlight: {
        visual: function(e) {
          var origin = e.rect.origin;
          var bottomRight = e.rect.bottomRight();
          var topRight = e.rect.topRight();
          var topLeft = e.rect.topLeft();

          var c = "green";
          var bc = "#555";

          var path = new kendo.drawing.Path({
            fill: {
              color:  c,
              opacity: 1,
            },
            stroke: {
              color: bc,
              opacity:  0.7,
              width: 2,
            }
          })
          .moveTo(origin.x, bottomRight.y)
          .lineTo(bottomRight.x, bottomRight.y)
          .lineTo(topRight.x, topRight.y)
          .lineTo(topLeft.x, topLeft.y)
          .close();

          return path;
        }
      }
The approach is demonstrated here - https://dojo.telerik.com/jAFdyHQb.
For displaying additional information on hover, use the tooltip.template or tooltip.format options. This allows you to fully customize the tooltip content.
I hope this helps.
Regards,
Neli
Progress Telerik
Love the Telerik and Kendo UI products and believe more people should try them? Invite a fellow developer to become a Progress customer and each of you can get a $50 Amazon gift voucher.
 Bronze
 Iron
Iron
 Veteran
Hi Neli,
Thanks for the response. would like to check if the onHover can be on the category level. meaning to say if hover on any of the bar for Mission & Vision, all the bar will change color?
Also would like to check if the layout I am asking is doable?

Hi Benjamin,
Here you will find an example where the series.highlight is used per series - https://dojo.telerik.com/aVAxtrvX/3
Regarding the layout, could you please provide a little bit more details of the expected appearance?
If you need to add also the dash type gridline you could use the respective configuration and its options:
- https://www.telerik.com/kendo-jquery-ui/documentation/api/javascript/dataviz/ui/chart/configuration/valueaxis.majorgridlines#valueaxismajorgridlines
For example:
 valueAxis: {
           ....
            minorGridLines: {
              color: "#aa00bb",
              visible: true,
              dashType: "dash",
              step: 25,
            }
          },
Here is the modified example: https://dojo.telerik.com/IrOeOdKE/3
Let me know in case you have any additional questions on the matter.
Regards,
Neli
Bronze
Iron
Veteran
Hi Neil,
for the highlighting currently the color will change when i hover on the individual bar. what i wanted is to change the color when i hover anyway in the red box area below. also can i check how do i add curved border for the 4 corner of the bar?
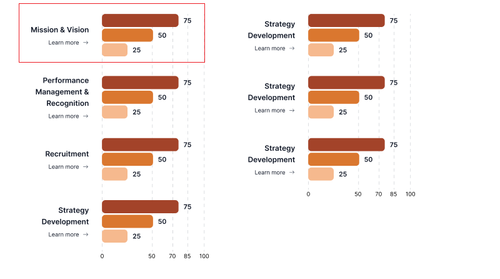
for the layout, i am able to get what i wanted with your latest dojo link
 Iron
Iron
 Iron
Iron
Hi Benjamin,
Here is a runnable version of the dojo example that provides a working approach for the rounded corners:
The described requirements are not built-in, so feel free to add the needed customizations by using the official API of the Chart widget:
This is a list of the available events for the widget, where you can find the sersHover event, but there is no event for hovering your red area
Kind Regards,
Anton Mironov
Bronze
Iron
Veteran
Hi Anton,
Thanks for your reply. Can i check if there is any workaround to achieve hovering the red area?
Further would like to check if it is possible to add a Learn more link to each category text?
Bronze
Iron
Veteran
Hi Anton,
dojo sample seems to be for column. for the bar type chart i cant seems get it to work
Hi Benjamin,
Please find here an example where the bars have rounded corners: https://dojo.telerik.com/TBqoXleh/8
In the example each bar is drawn using the Kendo Drawing API's Path with cubic bezier curves to approximate semicircular caps on both ends:
- Right end: two quarter-circle bezier curves create a right-facing semicircle.
- Left end: two quarter-circle bezier curves create a left-facing semicircle.
- Top/bottom: straight lineTo segments connect the two ends.
The corner radius is set to half the bar's height (height / 2), so the ends are perfectly pill-shaped regardless of bar size. The bezier control point offset uses the standard approximation factor 0.5523 * radius for an accurate circle shape. A linear gradient is applied horizontally to give the bar depth.
I hope this helps.
Regards,
Neli
Bronze
Iron
Veteran
tried integrating the corner radius to the existing sample. cant seems to get it to work
Hi Benjamin,
Regarding adding a link to the categories, I would suggest reviewing the following forum threads:
- https://www.telerik.com/forums/kendo-asp-net-mvc-add-a-link-to-custom-chart-legend
- https://www.telerik.com/forums/add-html-link-in-kendo-chart-categoryaxis-or-valueaxis-label
Here you will also find another example where the labels.visual is handled - https://dojo.telerik.com/rQDkyDSa.
Regards,
Neli
Iron
Iron
Here's a dojo https://dojo.telerik.com/uMsgVaLq that does the rounded corners and changes color on hover.
I did try a couple different ways to set the series colors so that the visual could just retrieve them there, but I couldn't get any to work, so I resorted to the hover flag, which seems a bit hacky but it works.
Hi Jay,
Thank you for sharing the modified example and your approach.
I am sure it will be helpful to the other users in the forum.
We appreciate your contribution and your willingness to help the community.
Regards,
Neli
Bronze
Iron
Veteran
i tried to integrate the sample into my own code. But I am getting some issue loading the chart. I have made a dojo replicating my issue
on page load chart will not load. when click on the buttons then chart will load
Iron
Iron
When I run your dojo, I get an error. I assume that is why the chart doesn't show up. The error seems to be because #domain-cards does not exist, and so its offset does not either, so you can't get its top.
Iron
Iron
Bronze
Iron
Veteran
Iron
Iron
Bronze
Iron
Veteran
Iron
Iron
The charts appear for me when I click the buttons. I think one of the problems is your layout is messed up. You have a grid layout with three columns, but you only have two columns, so the second chart is being shoved into a column that only has 1px width. You need to either add in the separator (https://dojo.telerik.com/IOXWOWhG) or remove that 1px column.
You also have a lot of other issues going on with duplicated chart text, etc. I think your dojo examples are overly complicated for whatever issue you're trying to resolve, like do you really need that visual function in the left chart? I would recommend providing an MCVE. It is quite likely in trying to produce an MCVE that you will solve your problem on your own, and if not, there's a much simpler example from which someone can try to help.
Hi Benjamin,
Here you will find modified Dojo example where the charts are displayed on button click - https://dojo.telerik.com/rEsazUXf
In the example from your reply I updated the chart configuration and layout to fix the rendering and readability issues that were affecting the charts. I would suggest removing the visual: null and color: "transparent" entries from seriesDefaults on both charts. Those two settings were interfering with Kendo’s default bar drawing behavior, so the bars could either disappear or fail to inherit the series colors that were already defined for each year. After removing them, the charts now render with the intended colors and standard Kendo visuals.
In addition, I also corrected the CSS grid used for the two chart areas. It was previously defined with 1fr 1px 1fr, which effectively squeezed one chart into a one pixel column. I changed that layout to 1fr 1fr so both charts receive equal usable width and display side by side correctly.
To prevent clipping, I changed the chart container from a fixed height: 130px to min-height: 130px. This allows the container to expand when JavaScript calculates a taller chart. Finally, I increased BAR_HEIGHT from 40 to 90, which gives each category enough vertical space for grouped bars and multiline labels without overlap.
I hope this helps.
Regards,
Neli