This is a migrated thread and some comments may be shown as answers.

Empty Gantt Item still consumes space, why?

3 Answers 26 Views
Chart (Obsolete)
This is a migrated thread and some comments may be shown as answers.
Steve
Top achievements
Rank 1
Steve asked on 26 Mar 2013, 08:40 PM
Hello,

I am trying to find out how to properly align a Gantt chart.  There are two Series and each series only contains one actual point, but they should be in different segments (1 & 2).  I can get this behavior to somewhat work by inserting a dummy item in each series, but even when trying to hide, set empty, and change the dummy item to 0px, it still holds the space even though it isn't there.  Below, this is to the left of the first and to the right of the second.  How can I achieve two series with one in each column where it doesn't have this empty yet allocated item space?


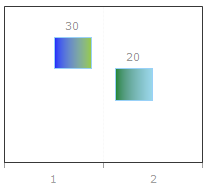
Here is the code I have that produces the above:
<telerik:RadChart ID="chartAnchorTip" SkinsOverrideStyles="true" runat="server" Width="225px"
    Height="200px" AutoLayout="true">
    <Appearance Border-Visible="false" Dimensions-AutoSize="true" TextQuality="ClearTypeGridFit" />
    <ChartTitle Visible="false" />
    <PlotArea Appearance-FillStyle-MainColor="White" Appearance-FillStyle-FillType="Solid">
        <XAxis MaxValue="6" MinValue="1" Step="1" />
        <YAxis MaxValue="60" Step="5" AxisMode="Extended" Visible="False" />
        <YAxis2 MaxValue="5" MinValue="1" Step="1" Visible="False" />
    </PlotArea>
    <Series>
        <telerik:ChartSeries Name="Series 1" Type="gantt">
            <Appearance LegendDisplayMode="ItemLabels" EmptyValue-Mode="Zero">
                <FillStyle MainColor="Green">
                </FillStyle>
            </Appearance>
            <Items>
                <telerik:ChartSeriesItem Visible="False" Empty="true" Label-Appearance-Visible="false"
                    Label-Appearance-Dimensions-Width="0px" Label-Appearance-Position-AlignedPosition="None"
                    PointAppearance-Dimensions-Width="0px" />
                <telerik:ChartSeriesItem YValue="20" YValue2="30" Name="Item 2" />
            </Items>
        </telerik:ChartSeries>
    </Series>
    <Series>
        <telerik:ChartSeries Name="Series 2" Type="gantt">
            <Appearance LegendDisplayMode="ItemLabels" EmptyValue-Mode="Zero">
                <FillStyle MainColor="Blue">
                </FillStyle>
            </Appearance>
            <Items>
                <telerik:ChartSeriesItem YValue="30" YValue2="40" Name="Item 1" />
                <telerik:ChartSeriesItem Visible="False" Empty="true" Label-Appearance-Visible="false"
                    Label-Appearance-Dimensions-Width="0px" Label-Appearance-Position-AlignedPosition="None"
                    PointAppearance-Dimensions-Width="0px" />
            </Items>
        </telerik:ChartSeries>
    </Series>
    <Legend Visible="false" />
</telerik:RadChart>

3 Answers, 1 is accepted

Sort by
0
MasterChiefMasterChef
Top achievements
Rank 2
answered on 27 Mar 2013, 03:40 PM
Hi Steve,

Is there a reason you have two y axes? It is set to visible="false", but it could be the reason for all the white space. Try taking out the line declaring YAxis2 and see if it fixes your problem.

Good luck,
Master Chief
0
Steve
Top achievements
Rank 1
answered on 27 Mar 2013, 03:53 PM
Master Chief,

Thanks for the reply.  The first Y Axis controls the lower bound and the second Y Axis controls the upper bound of the Gantt Point; respectively (in this case, this represents a height of 10).  I tried removing Y2, but it renders the chart into a bar chart and still does not remove the dead item space.

Regards,

Steve
0
Steve
Top achievements
Rank 1
answered on 27 Mar 2013, 04:43 PM
I was able to figure this out through some additional trial and error.  The XValue also had to be set to the respective column/Series, as well as some additional manipulation of the PlotArea settings:


In case anyone else runs into a similar issue and needs the solution:

<telerik:RadChart ID="chartAnchorTip" SkinsOverrideStyles="True" runat="server" Width="225px"
    Height="200px" AutoLayout="True" DefaultType="Gantt">
    <Appearance Border-Visible="false" Dimensions-AutoSize="true" TextQuality="ClearTypeGridFit">
        <Border Visible="False"></Border>
    </Appearance>
    <ChartTitle Visible="false">
        <Appearance Visible="False">
        </Appearance>
    </ChartTitle>
    <PlotArea Appearance-FillStyle-MainColor="White" Appearance-FillStyle-FillType="Solid">
        <XAxis MaxValue="2" MinValue="1" Step="1" AutoScale="False" LayoutMode="Between" />
        <YAxis MinValue="0" MaxValue="70" Step="10" AutoScale="False" AxisMode="Extended" Visible="False" />
        <YAxis2 MinValue="0" MaxValue="70" Step="10" AutoScale="False" AxisMode="Extended" Visible="False" />
        <Appearance>
            <FillStyle MainColor="White" FillType="Solid" />
        </Appearance>
    </PlotArea>
    <Series>
        <telerik:ChartSeries Name="Series 1" Type="gantt" Appearance-BarWidthPercent="150" >
            <Appearance LegendDisplayMode="ItemLabels" EmptyValue-Mode="Zero">
                <FillStyle MainColor="Green" />
            </Appearance>
            <Items>
                <telerik:ChartSeriesItem Name="Item 2" XValue="1" YValue="20" YValue2="30" />
            </Items>
        </telerik:ChartSeries>
        <telerik:ChartSeries Name="Series 2" Type="Gantt" Appearance-BarWidthPercent="150">
            <Appearance LegendDisplayMode="ItemLabels">
                <FillStyle MainColor="Blue" />
            </Appearance>
            <Items>
                <telerik:ChartSeriesItem Name="Item 1" XValue="2" YValue="40" YValue2="50" />
            </Items>
        </telerik:ChartSeries>
    </Series>
    <Legend Visible="false">
        <Appearance Visible="False">
        </Appearance>
    </Legend>
</telerik:RadChart>

Tags
Chart (Obsolete)
Asked by
Steve
Top achievements
Rank 1
Answers by
MasterChiefMasterChef
Top achievements
Rank 2
Steve
Top achievements
Rank 1
Share this question
or