Hi,
Please look at the markup for the donut chart:
I then bind this in the page_load event to a datasource that is a collection of my custom entity.
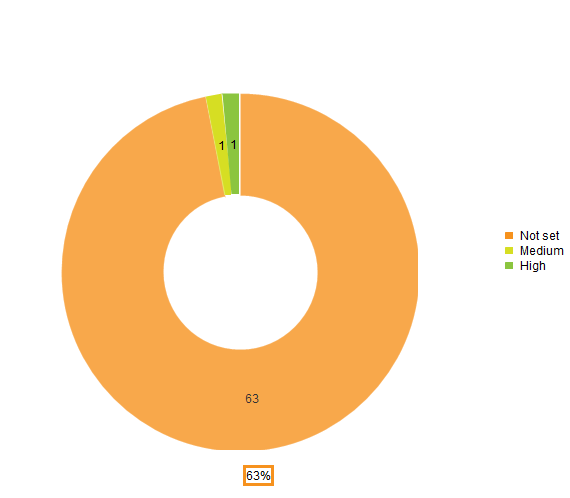
When I look at the chart I see 3 slices. 1st Slice shows 63%, second 1% and the third 1%. As you can see that does not add up to 100%. I have debugged the code and verified that the collection has 65 items, with one portion containing 63, second 1, and last 1 item. It appears as if instead of showing % it is just displaying the totals.
How do I get it to display the %?
Please look at the markup for the donut chart:
<telerik:RadHtmlChart runat="server" ID="DonutChart1" Height="600px" Width="600px" OnClientSeriesClicked="OnClientSeriesClicked"> <ChartTitle Text="Deficiencies by Risk Rating" /> <PlotArea> <Series> <telerik:DonutSeries DataFieldY="Size" NameField="State" ExplodeField="IsExploded"> <TooltipsAppearance DataFormatString="{0}%"></TooltipsAppearance> </telerik:DonutSeries> </Series> </PlotArea> </telerik:RadHtmlChart>I then bind this in the page_load event to a datasource that is a collection of my custom entity.
protected void Page_Load(object sender, EventArgs e) { DonutChart1.DataSource = ReportingBLL.GetDepartmentPieChartDataByPriority(); DonutChart1.DataBind(); }When I look at the chart I see 3 slices. 1st Slice shows 63%, second 1% and the third 1%. As you can see that does not add up to 100%. I have debugged the code and verified that the collection has 65 items, with one portion containing 63, second 1, and last 1 item. It appears as if instead of showing % it is just displaying the totals.
How do I get it to display the %?
8 Answers, 1 is accepted
0

Richard
Top achievements
 Rank 1
answered on 13 May 2013, 03:46 PM
Hi,
Can I get some help with this please?
Can I get some help with this please?
0

Hi Richard,
You can use the ClientTemplate functionality of the RadHtmlChart in order to display the percentage of each Series Item in the ToolTips. For example:
You can also find useful Formatting Numbers and ClientTemplate for Series Labels and Tooltips help articles.
Kind regards,
Danail Vasilev
the Telerik team
You can use the ClientTemplate functionality of the RadHtmlChart in order to display the percentage of each Series Item in the ToolTips. For example:
<telerik:RadHtmlChart runat="server" ID="DonutChart1" Height="600px" Width="600px" OnClientSeriesClicked="OnClientSeriesClicked"> <ChartTitle Text="Deficiencies by Risk Rating" /> <PlotArea> <Series> <telerik:DonutSeries DataFieldY="Size" NameField="State" ExplodeField="IsExploded"> <TooltipsAppearance ClientTemplate="#=kendo.format(\'{0:P0}\', percentage)#" Visible="true" /> </telerik:DonutSeries> </Series> </PlotArea> </telerik:RadHtmlChart>You can also find useful Formatting Numbers and ClientTemplate for Series Labels and Tooltips help articles.
Kind regards,
Danail Vasilev
the Telerik team
If you want to get updates on new releases, tips and tricks and sneak peeks at our product labs directly from the developers working on the RadControls for ASP.NET AJAX, subscribe to their blog feed now.
0
Sam
Top achievements
Rank 1
answered on 25 Aug 2013, 11:10 AM
Thanks, percentage working fine. I want to show name and percentage both in label, how to do that?
0
Hi Sam,
You can display the name of the PieSeriesItem in the ClientTemplate through the 'category' property. For example:
The information about these new properties from the ClientTemplate will be updated in our documentation for the upcoming Q3 2013, scheduled for middle of October.
Regards,
Danail Vasilev
Telerik
You can display the name of the PieSeriesItem in the ClientTemplate through the 'category' property. For example:
<LabelsAppearance ClientTemplate="Percentage: #=kendo.format(\'{0:P0}\', percentage)#, Name: #=category#" Visible="true" />The information about these new properties from the ClientTemplate will be updated in our documentation for the upcoming Q3 2013, scheduled for middle of October.
Regards,
Danail Vasilev
Telerik
If you want to get updates on new releases, tips and tricks and sneak peeks at our product labs directly from the developers working on the RadControls for ASP.NET AJAX, subscribe to the blog feed now.
0
Sam
Top achievements
Rank 1
answered on 26 Aug 2013, 07:47 PM
Thanks Danail, your suggestion working fine. Is it possible to customize legend? I want to add legend title, order legend by higher value to lower and add custom colors to my RadHtmlChart-Pie slices(having more than 20 slices and color are repeating, i dont want repeated colors)
0
Hello Sam,
I have already replayed to you ticket, so I paste my answer here for the rest people in the forum.
In order to set custom colors for a databound RadHtmlChart, you can use the ColorField property exposed by the series. For example:
ASPX:
C#:
where Color is the name of the field from the datasource which consists the colors of the series items. You can find the full VS example in this online demo.
Regarding your second question about reordering the items in the legend, I am sorry to say that such a functionality is not supported out of the box. The order of the items from the legend matches the order of the PieSeriesItem from the SeriesItems collection. Therefore, in order to achieve that you can reorder the datasource of the chart.
Regards,
Danail Vasilev
Telerik
I have already replayed to you ticket, so I paste my answer here for the rest people in the forum.
In order to set custom colors for a databound RadHtmlChart, you can use the ColorField property exposed by the series. For example:
ASPX:
<telerik:RadHtmlChart ID="RadHtmlChart1" runat="server" Width="650px" Height="450px"> <ChartTitle Text="Countries Exporting Crude Oil the United States (in Thousands of Barrels)"> </ChartTitle> <PlotArea> <Series> <telerik:PieSeries DataFieldY="Barrels" ColorField="Color" ExplodeField="IsExploded" NameField="Country"> <LabelsAppearance DataFormatString="{0:N0} bbl"> </LabelsAppearance> <TooltipsAppearance Color="White" /> </telerik:PieSeries> </Series> </PlotArea></telerik:RadHtmlChart>protected void Page_Load(object sender, System.EventArgs e) { RadHtmlChart1.DataSource = GetData(); RadHtmlChart1.DataBind(); } protected DataTable GetData() { DataTable tbl = new DataTable(); tbl.Columns.Add(new DataColumn("Barrels")); tbl.Columns.Add(new DataColumn("Country")); tbl.Columns.Add(new DataColumn("Color")); tbl.Columns.Add(new DataColumn("IsExploded")); tbl.Rows.Add(new object[] { 80309, "Canada", "Black", true }); tbl.Rows.Add(new object[] { 46428, "Saudi Arabia", "Gray", false }); tbl.Rows.Add(new object[] { 40573, "Mexico", "DarkGray", false }); tbl.Rows.Add(new object[] { 40154, "Venezuela", "DarkRed", false }); return tbl; }where Color is the name of the field from the datasource which consists the colors of the series items. You can find the full VS example in this online demo.
Regarding your second question about reordering the items in the legend, I am sorry to say that such a functionality is not supported out of the box. The order of the items from the legend matches the order of the PieSeriesItem from the SeriesItems collection. Therefore, in order to achieve that you can reorder the datasource of the chart.
Regards,
Danail Vasilev
Telerik
If you want to get updates on new releases, tips and tricks and sneak peeks at our product labs directly from the developers working on the RadControls for ASP.NET AJAX, subscribe to the blog feed now.
0
Shane Stiles
Top achievements
Rank 1
answered on 19 Dec 2015, 09:59 PM
Hi
I have same issue but I would like to get series apperance ovelay gradiant to none.How I can I set ?
Shreya.
0

Hi Shreya,
The Overlay-Gradient property is not boundable. However, I suspect you want to disable the gradient overlay for all items. Here you are an example based on the code from Danail's sample:
Regards,
Ianko
Telerik
The Overlay-Gradient property is not boundable. However, I suspect you want to disable the gradient overlay for all items. Here you are an example based on the code from Danail's sample:
<telerik:RadHtmlChart ID="RadHtmlChart1" runat="server" Width="650px" Height="450px"> <ChartTitle Text="Countries Exporting Crude Oil the United States (in Thousands of Barrels)"> </ChartTitle> <PlotArea> <Series> <telerik:PieSeries DataFieldY="Barrels" ColorField="Color" ExplodeField="IsExploded" NameField="Country"> <Appearance> <Overlay Gradient="None" /> </Appearance> <LabelsAppearance DataFormatString="{0:N0} bbl"> </LabelsAppearance> <TooltipsAppearance Color="White" /> </telerik:PieSeries> </Series> </PlotArea></telerik:RadHtmlChart>Regards,
Ianko
Telerik
Do you want to have your say when we set our development plans?
Do you want to know when a feature you care about is added or when a bug fixed?
Explore the
Telerik Feedback Portal
and vote to affect the priority of the items