
Hi,
Base on this post ; i able to draw the Base line like figure 1.0 below
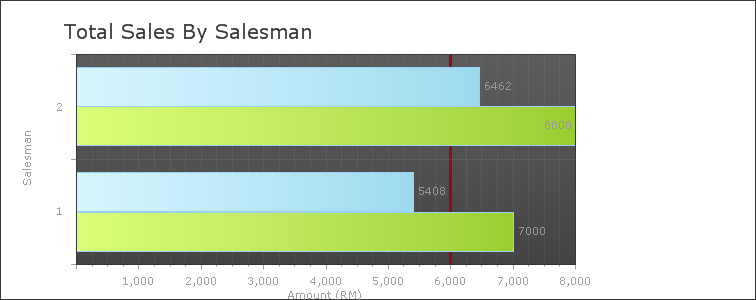
Figure 1.0
Problem (Sale and SalesTarget In one column show like below figure: 1.1)
How can i integrate the saleAmount and the SaleTarget show like example below
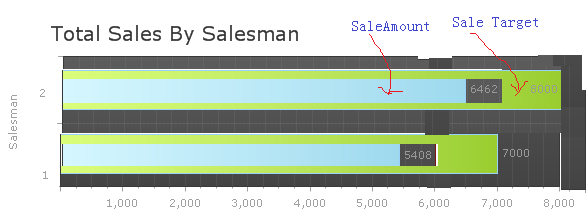
Figure 1.1
Or Dynamic Draw the MarkZone in each column as SaleTarget like Figure 1.2 below
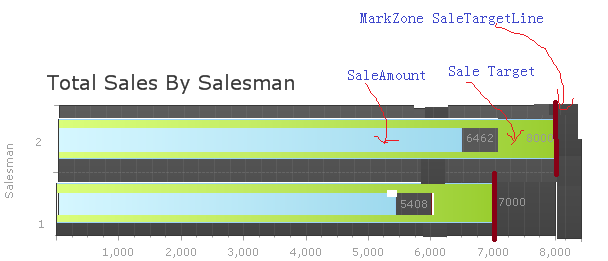
Figure 1.2
Regarding,
Tan
Base on this post ; i able to draw the Base line like figure 1.0 below
Figure 1.0
Problem (Sale and SalesTarget In one column show like below figure: 1.1)
How can i integrate the saleAmount and the SaleTarget show like example below
Figure 1.1
Or Dynamic Draw the MarkZone in each column as SaleTarget like Figure 1.2 below
Figure 1.2
Regarding,
Tan

