Hi,
I am trying to implement RadSwitch in a Web Forms application. I copied the CSS from the Telerik Demo. When I apply the CSS class to a RadSwitch contained directly in the web form, it displays correctly. However, when I apply the same class to a RadSwitch contained in a web user control, it doesn’t display correctly.
I have tried several workarounds, including copying the CSS and embedding it into the web user control, but nothing works. The RadSwitch still displays incorrectly. The web user control and the RadSwitch that displays correctly are not in the same web form.
Here is the CSS:
/*Create elastic RadSwitch*/
.RadButton.RadSwitch.elasticSwitch .k-switch-handle {
width: 2em !important;
height: 2em !important;
display: flex !important;
}
.RadButton.RadSwitch.k-switch-on.elasticSwitch .k-switch-handle {
left: calc( 100% - 2em) !important;
display: flex !important;
}
.RadButton.RadSwitch.elasticSwitch,
.RadButton.RadSwitch.elasticSwitch .k-switch-container {
width: 4em !important;
display: flex !important;
}
Here are the CSS references for the web form and the web user control:
Web form CSS reference:
<asp:Content ID="Content1" ContentPlaceHolderID="HeadContent" runat="server">
<link href="<%= Page.ResolveUrl("~/CSS/Custom.css") %>" rel="stylesheet" type="text/css" />
</asp:Content>
Web user control CSS reference:
<link href="<%= Page.ResolveUrl("~/CSS/Custom.css") %>" rel="stylesheet" type="text/css" />
Here is the HTML for the correctly displaying RadSwitch:
<telerik:RadSwitch runat="server" ID="TipoRequerimientoRequiereAcuse" Checked="false"
CssClass="elasticSwitch"
AutoPostBack="false">
</telerik:RadSwitch>
And here is the HTML for the RadSwich in the web user control:
<telerik:RadSwitch runat="server" ID="chkInformativo" Checked="false"
CssClass="elasticSwitch"
AutoPostBack="false">
</telerik:RadSwitch>
Has anyone else experienced this situation before? How did you solve it?
Hi Telerik Team,
We are having the following requirement to display in our asp.net webform application. I were trying for Gantt view. But seems, it doesn't support multiple tasks to be shown in single line. Other option suggested is Rad Scheduler. As I am new to it, before going ahead with exploration, want to get confirmation that which control will suite our requirement. Please provide your feedback.
Thanks
Sathyendranath Pai
Sample requirement :
Imports Telerik.Web.UI

Partial Class TestPage
    Inherits System.Web.UI.Page


    Protected Sub Start_RadButton1_Click(ByVal sender As Object, ByVal e As EventArgs) Handles Start_RadButton1.Click
        ShowRadWindowWithContent(RadTextBox7.Text)
    End Sub

    Protected Sub Start_RadButton2_Click(ByVal sender As Object, ByVal e As EventArgs) Handles Start_RadButton2.Click
        ShowRadWindowWithContent(RadTextBox8.Text)
    End Sub

    Private Sub ShowRadWindowWithContent(ByVal content As String)
        ' Encode content to be safely used in JavaScript
        Dim encodedContent As String = HttpUtility.JavaScriptStringEncode(content)

        ' Register JavaScript to update and show the RadWindow
        Dim script As String = "function openRadWindow() { " _
        & "    var radWindow = $find('" & RadWindow2.ClientID & "'); " _
        & "    if (radWindow) { " _
        & "        var contentLabel = radWindow.get_contentElement().querySelector('#DynamicLabel'); " _
        & "        if (contentLabel) { " _
        & "            contentLabel.innerHTML = '" & encodedContent & "'; " _
        & "        } " _
        & "        radWindow.show(); " _
        & "    } " _
        & "} openRadWindow();"

        RadScriptManager.RegisterStartupScript(Me, Me.GetType(), "ShowRadWindow", script, True)
    End Sub
End Class
<%@ Page Language="vb" AutoEventWireup="false" CodeFile="TestPage.aspx.vb" Inherits="TestPage" %>
<%@ Register TagPrefix="telerik" Namespace="Telerik.Web.UI" Assembly="Telerik.Web.UI" %>
<!DOCTYPE html>
<html lang="en">
<head>
<meta charset="utf-8" />
<title>Dynamic RadWindow Example</title>
</head>
<body>
<form id="form1" runat="server">
<telerik:RadScriptManager ID="RadScriptManager1" runat="server"></telerik:RadScriptManager>
<telerik:RadWindow ID="RadWindow2" runat="server" Modal="True" Skin="Metro" Visible="false">
<ContentTemplate>
<div class="content-container">
<div class="rad-label">
<telerik:RadLabel Text="Start Task?" runat="server" style="color: azure" />
</div>
<div id="contentContainer">
<telerik:RadLabel ID="DynamicLabel" runat="server" />
</div>
<div class="button-container">
<asp:Button ID="Button1" runat="server" Text="Start" />
<asp:Button ID="Button2" runat="server" Text="Cancel" />
</div>
</div>
</ContentTemplate>
</telerik:RadWindow>
<telerik:LayoutRow>
<Columns>
<telerik:LayoutColumn Span="3" SpanXs="0" SpanSm="0">
<div class="col">
<label>Test: </label>
</div>
</telerik:LayoutColumn>
<telerik:LayoutColumn Span="8" SpanXs="12" SpanSm="12">
<telerik:RadTextBox ID="RadTextBox7" RunAt="server"/>
<telerik:RadButton ID="Start_RadButton1" runat="server" Text="Start" OnClick="Start_RadButton1_Click" />
</telerik:LayoutColumn>
</Columns>
</telerik:LayoutRow>
<telerik:LayoutRow>
<Columns>
<telerik:LayoutColumn Span="3" SpanXs="0" SpanSm="0">
<div class="col">
<label>TimeStamp: </label>
</div>
</telerik:LayoutColumn>
<telerik:LayoutColumn Span="8" SpanXs="12" SpanSm="12">
<telerik:RadTextBox ID="RadTextBox8" RunAt="server"/>
<telerik:RadButton ID="Start_RadButton2" runat="server" Text="Start" OnClick="Start_RadButton2_Click" />
<telerik:RadButton ID="RadButton22" runat="server" Text="Completed"/>
</telerik:LayoutColumn>
</Columns>
</telerik:LayoutRow>
</form>
</body>
</html>

So i have the following ItemTemplate defined for a RadGrid
<telerik:GridTemplateColumn DataField="Description" HeaderText="Description">
	<ItemTemplate>
		<iframe>
			<telerik:RadEditor ID="ContentEditor1" onClientLoad="OnClientLoad" CssClass="Modal-Scroll2" Enabled="false" ToolsFile="~/ToolsFileEmpty.xml" runat="server" EditModes="Preview" NewLineMode="br" ContentFilters="DefaultFilters" Width="100%" >
				<CssFiles>
					<telerik:EditorCssFile Value="~/css/EditorStyles.css" />
				</CssFiles>
			</telerik:RadEditor>
		</iframe>
	</ItemTemplate>
</telerik:GridTemplateColumn>
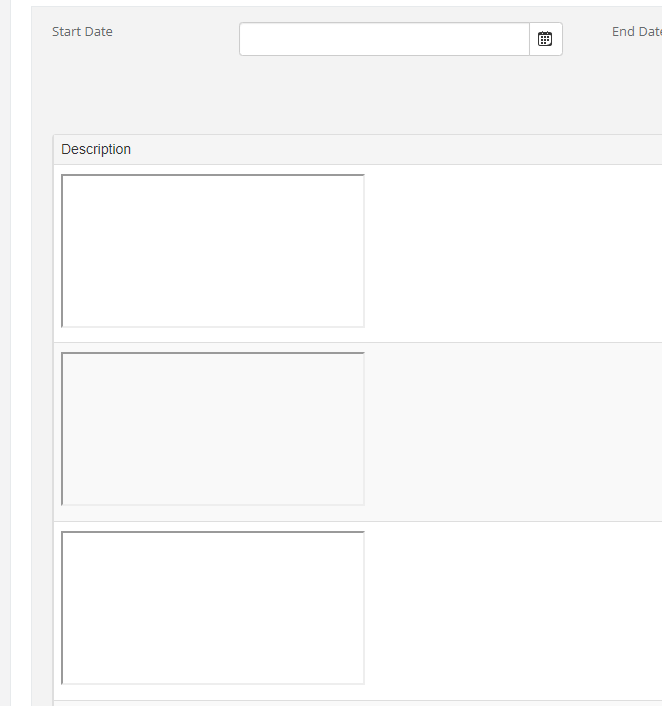
However, when this renders on the page, the editor content appears in the wrong place:

and the end result is a bunch of empty iframes:

Ideas?
-Mark
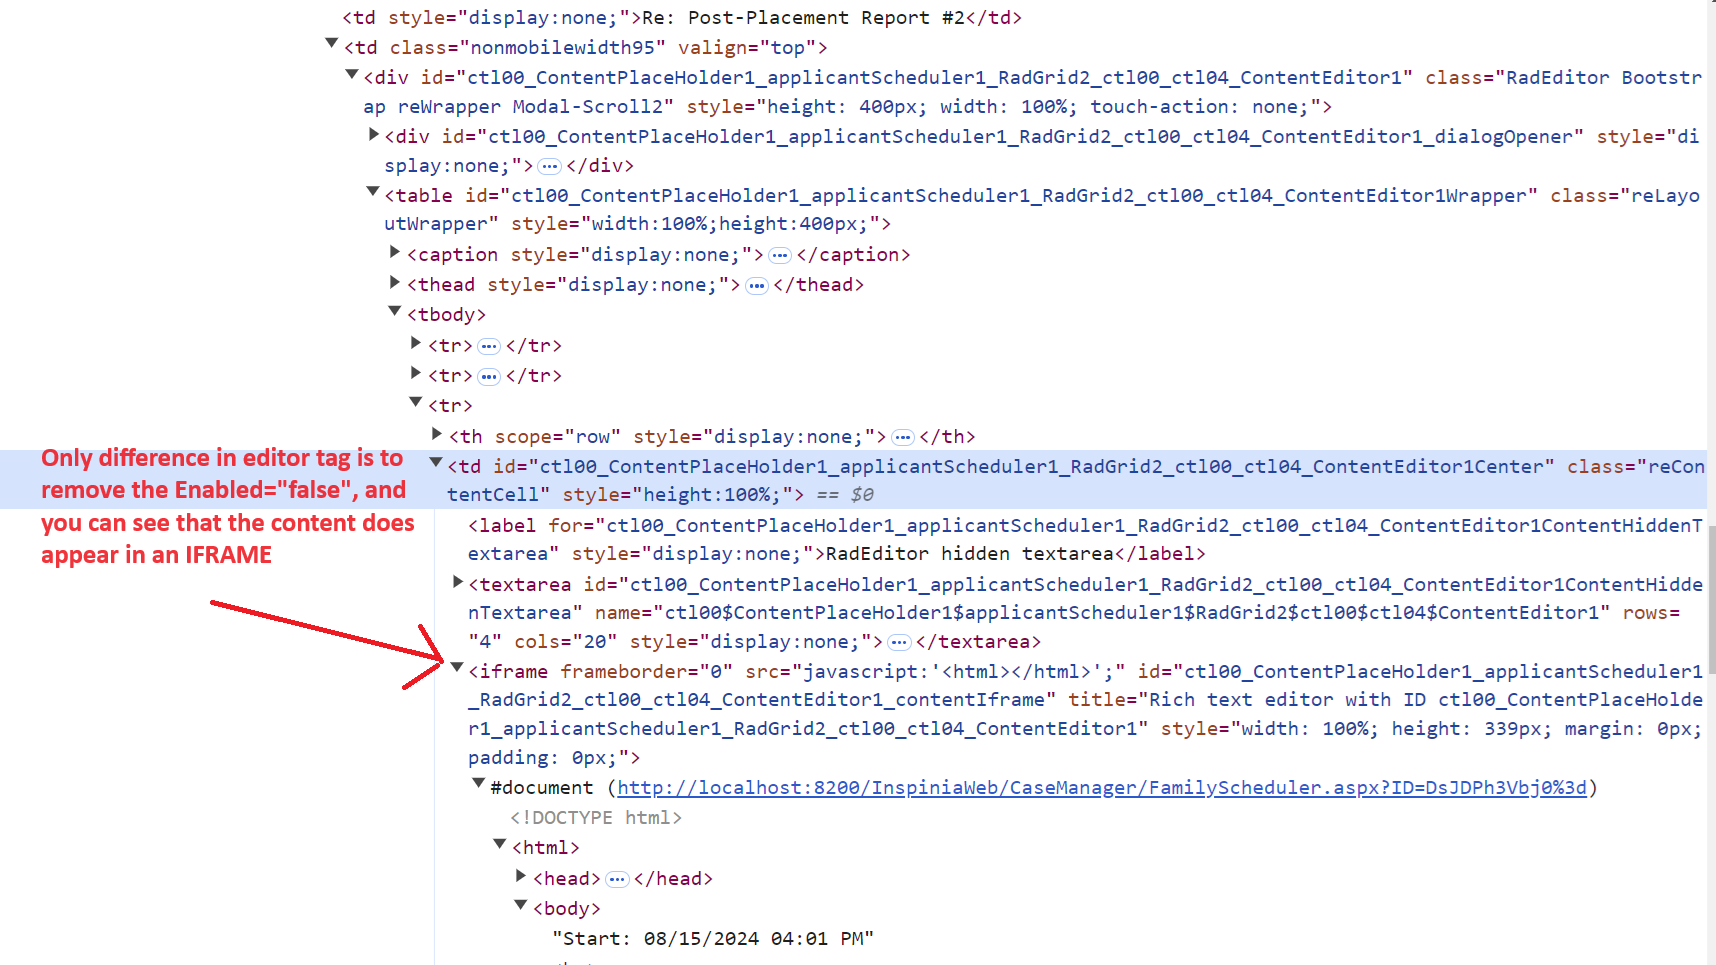
I have blocks of HTML that are entered (usually copy and pasted in from email messages) by users of our system. We don't know what this content will contain, or if the content (html) is even completed (maybe the copied part of a HTML message). For that reason we display the content in a radeditor. This content is read-only, so we set the Enabled property of the RadEditor to "false". However when we do that, the content is no longer displayed in an iframe, despite using ContentAreaMode="Iframe".

When the editor is Enabled, it renders like this instead:

The reason that we are trying to have the content rendered in an IFRAME is because this content sometimes includes CSS/Styles that modify the content in the parent container.
For instance today we discovered this HTML embedded into a <style> tag.
div {
       display: block !important;
       visibility: visible !important;
       opacity: 1 !important
    }
And this caused all kinds of rendering problems on the page because it forced a ton of modal popup <div>'s to become visible that should be hidden.
Thanks for your help!
-Mark


Hi,
I cannot see the latest two downloaded version in my Update Wizard screen.
They are in the Update folder though, see screenshots.
VS 2022 Community with latest Telerik VS Extension.
Any suggestions?
Marc
 Rank 2
 Bronze
 Iron
Iron
 Iron
Iron
Hi,
Since the Microsoft.WindowsAzure.Storage is already deprecated, the RadCloudUpload is broken. Is there a solution for this or alternatives that you can suggest? Thank you


Hi !
I've got strange behavior with RadAjaxManager.no problem without radAjaxManager
Normally I have a panel and editing in that panel should update its contents. but strange behaviors appear.
To test, I just added 2 edit boxes only for updating.
Example project and example video to explain.
1) Set "cumul" => calculate and update the content deductionRG (AjaxSetting)
2) Set "Pénalités" => Calculate and update Total Deductions content (AjaxSetting)
But Event is launched on Montant RG???
Radnumeric is disabled and I don't want the event to be fired if there was no user input.
3) Set "Autre" => Event launched but content received: 0
4) Define "Autre" again (other value: 80) => Value of the content received by the event: 80
This is a simple example, because this edition panel modifies for the user according to conditional parameters on the screen during the instance of the calculation class.
I've read the documentation https://docs.telerik.com/devtools/document-processing/libraries/radspreadprocessing/features/grouping but haven't had any luck in implementing it.
 Rank 1


