What's New in Vue Devtools 5.0 Beta

Summarize with AI:
Debugging Vue apps just got better. Check out the features in the latest beta of Vue Devtools, including the new routing, performance and settings tabs.
Vue Devtools helps with inspecting Vue.js applications, and with the latest pre-release, 5.0 beta.1, there are interesting additions and improvements to Devtools. I've been really excited since I tried it out, and I'm eager to share with you the new features that were added.
This release comes with three new tabs: a Routing Tab, a Performance Tab, and a Settings Tab. It also allows editing of Vuex state from right inside the Vuex tab, which means a better debugging experience!
Let's get started by inspecting this HackerNews clone in Vue, and installing Devtools. Follow the instructions on that GitHub page to set up and start the sample project. Then add the Devtools Chrome extension or Firefox extension, depending on your preferred browser. With that set up, open the app in your browser, open your browser's Devtools and navigate to the Vue tab.
Routing Tab
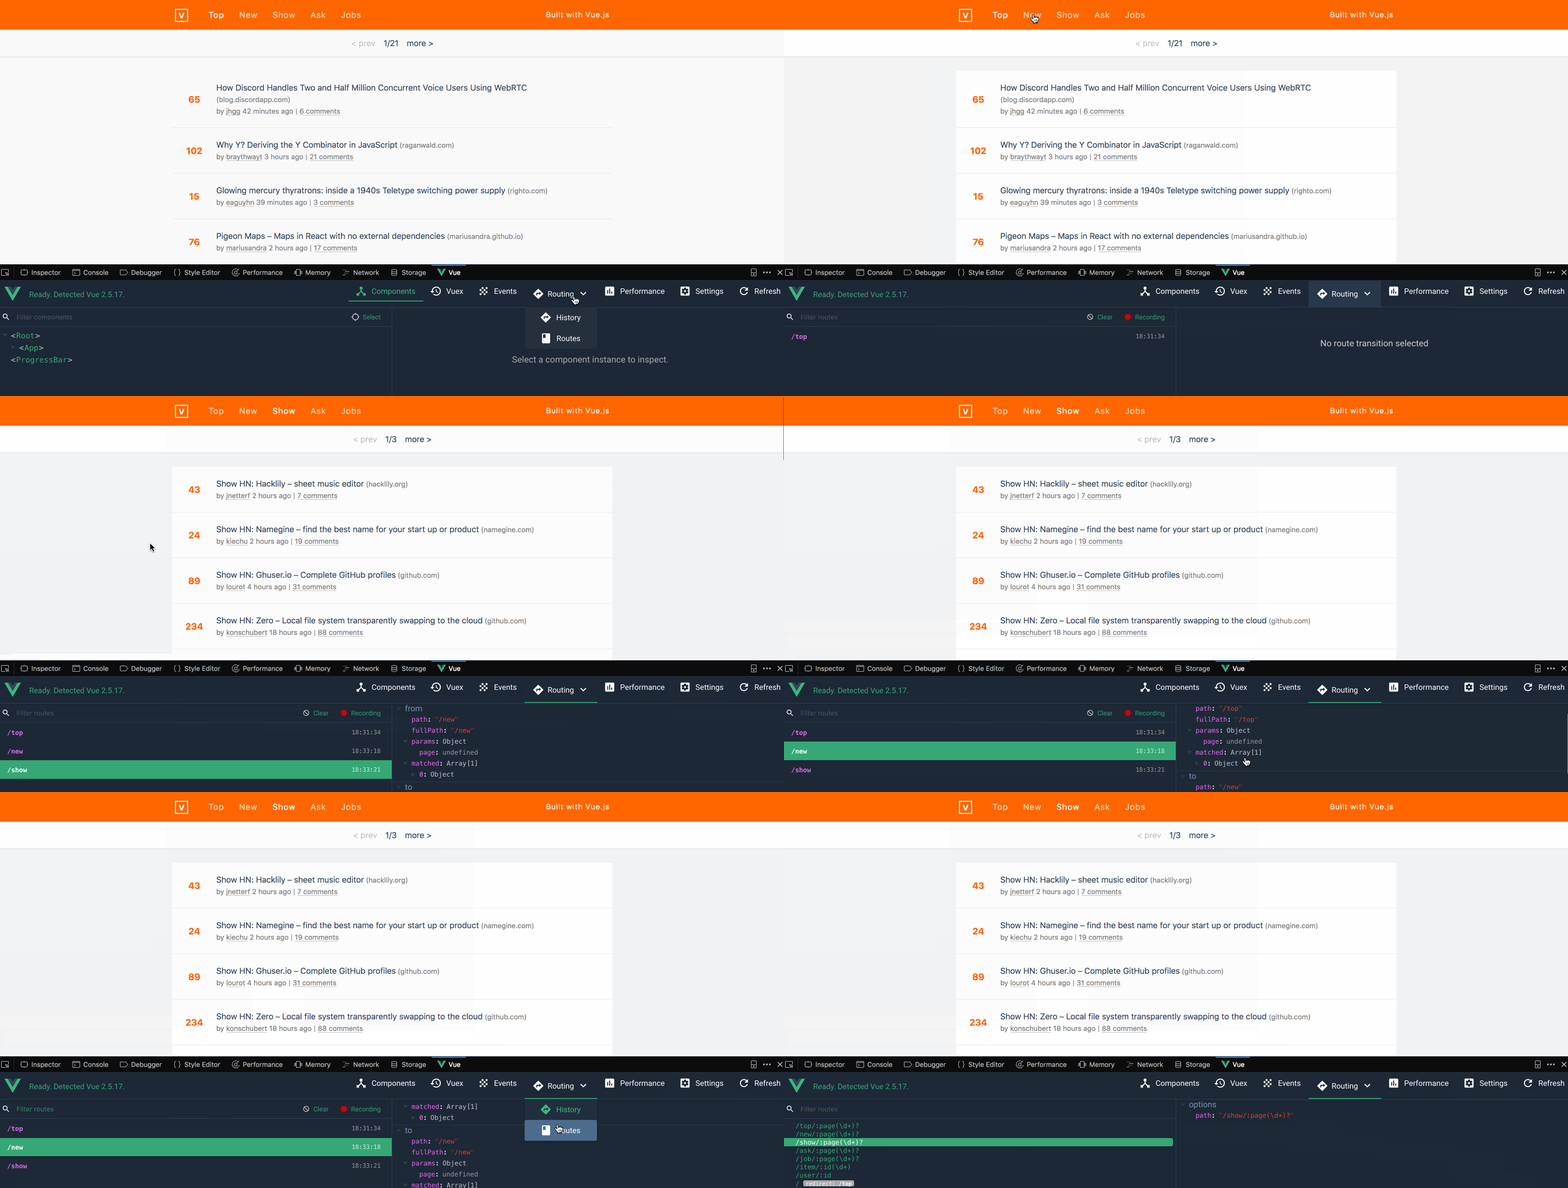
The Routing tab records the Vue Router's history as you move across pages in your application, and also has a page to show you the routes defined for the application. Hovering over the Routing tab and selecting History will show the recorded history as you navigate through the application. Selecting Routes will show the routes defined for that application.
Performance Tab
The Performance tab shows the analysis of the runtime performance of your app and shows you how long it took the different components in the app to render, as well as the frame rate. To inspect performance, we need to hit the record button at top left corner, then switch between the frame rate and the component render views by clicking one of the buttons at the top right corner.
With Frames per second selected, we can see the frame rate being recorded as we navigate through the application. From the image above, you will notice that there are times when we get a low frame rate. This happened when we switched to a new route. It required fetching the items to display on the page, and rendering a subset of those items on the page. Its default is 20 items on a page. Hovering over the lines shows the frame rate per second. We also get icons above it, with markers R for route, and M for mutations. Hovering over them shows how many routes or mutations it had.
Clicking on the Component render button shows a list of components and how long it took each to render. You can see that the RouterLink component took the longest. Selecting a component shows more information on the right pane. It shows the total and average time it took for the different lifecycle events of that component. I find this valuable, as you can tell what is affecting performance and, therefore, fix accordingly.
Settings Tab
The Settings tab is where we customize options like the Devtools color, display density, and if it should use Pascal case or the original component name when displaying components.
Editable Vuex state
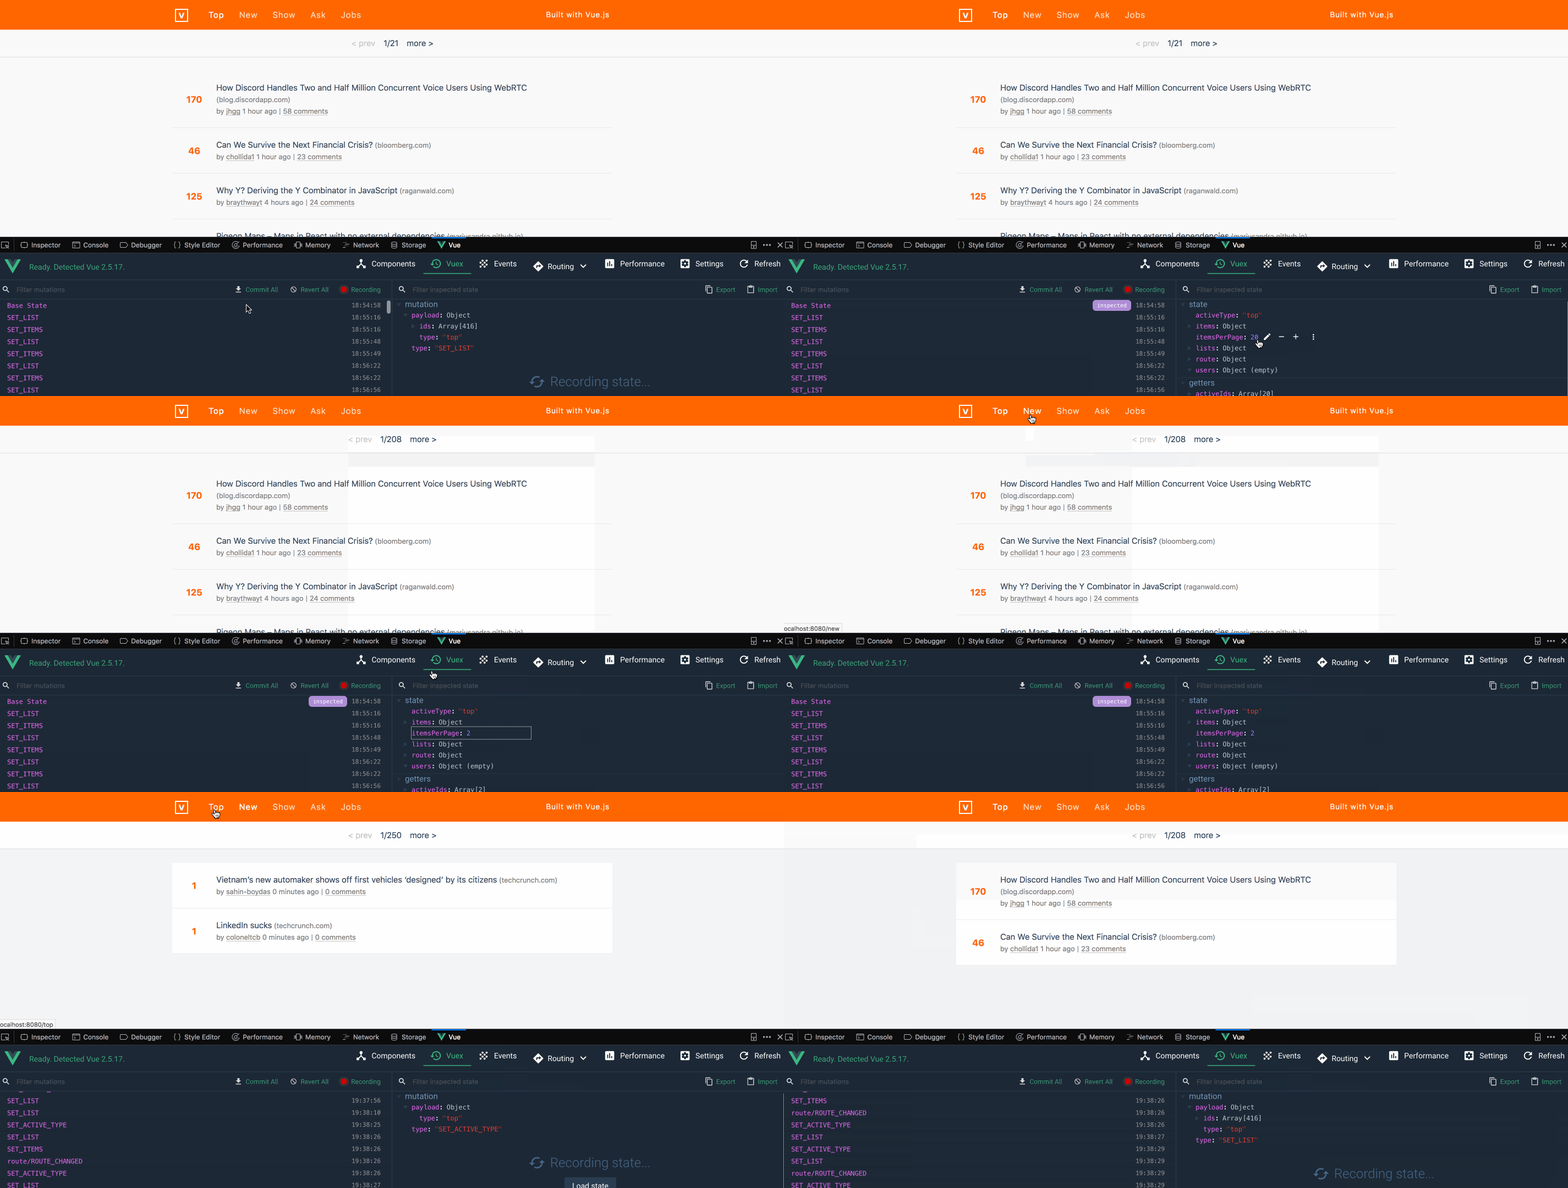
In the previous release, we already had the Vuex tab. It allowed us to inspect Vuex state mutations. In this release, we can edit Vuex state directly from Devtools.
From the screenshot above, you can see that when we changed the itemsPerPage to 2, it listed just two items on the list as we moved between pages. This gives us the benefit of changing state and seeing how the app responds.
That's A Wrap!
You've seen the new features in the latest release: the Routing, Performance, and Settings tabs. These are awesome additions, and I'm really looking forward to what's to come in the next beta. Use these tools to your advantage and give your users a better performing app while easily debugging your Vue.js application. And if you're looking for an awesome set of UI tools to improve the look, feel and performance of your Vue apps, don't forget to check out Kendo UI for Vue too.
If you're new to Vue and have never used Vue Devtools, check out my other post on Getting Familiar with Vue Devtools to get you up to speed.

Peter Mbanugo
Peter is a software consultant, technical trainer and OSS contributor/maintainer with excellent interpersonal and motivational abilities to develop collaborative relationships among high-functioning teams. He focuses on cloud-native architectures, serverless, continuous deployment/delivery, and developer experience. You can follow him on Twitter.


