Use Fiddler Everywhere to Inspect Your Web Traffic

Summarize with AI:
Fiddler Everywhere is a popular tool among developers for inspecting and debugging network issues.
To enable developers to diagnose and monitor network traffic, Fiddler Everywhere provides the Traffic Inspector feature.

If you are new here, Fiddler Everywhere is a tool for network debugging and monitoring. It logs all the HTTP(S) traffic between the client and the internet. The tool is handy to inspect, debug, mock, and share network requests and responses. You can check out this starter guide to get you started with Fiddler Everywhere.
Web Sessions
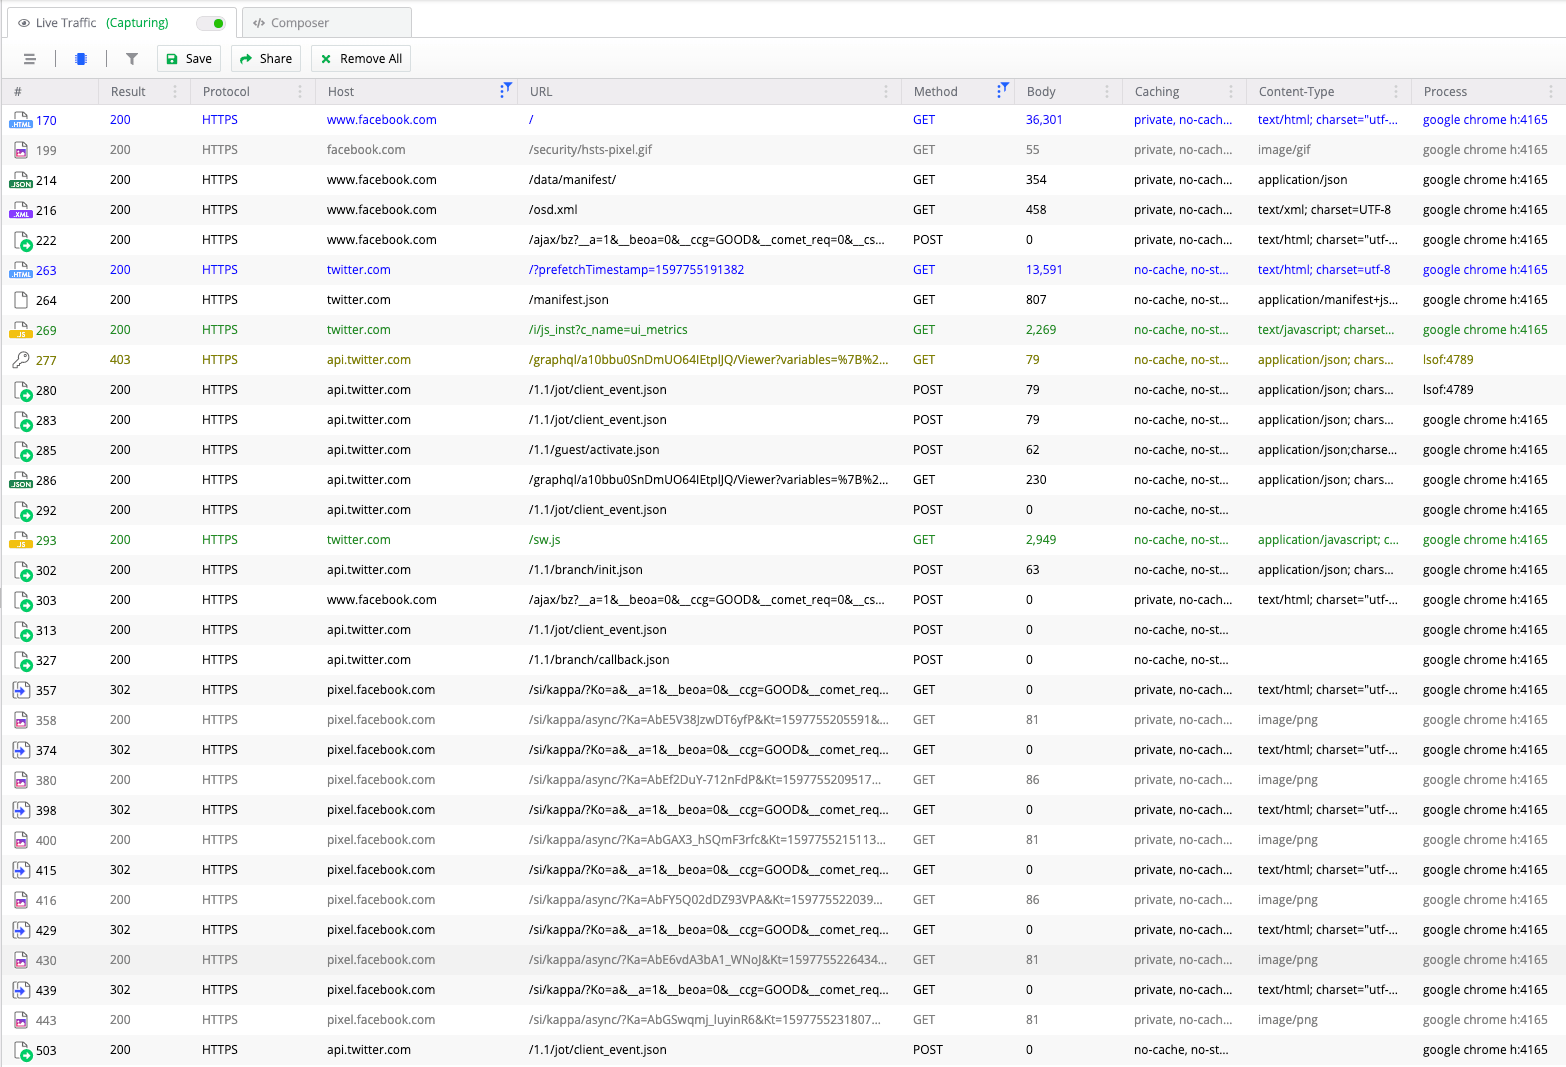
Fiddler Everywhere captures individual web sessions, which is a single transaction between a client and the server. Each web session contains a pair of Request headers and Response headers, along with a set of flags that contain the session metadata and a timer. The web sessions are all logged in the Live Traffic tab in Fiddler Everywhere.
Traffic Inspector
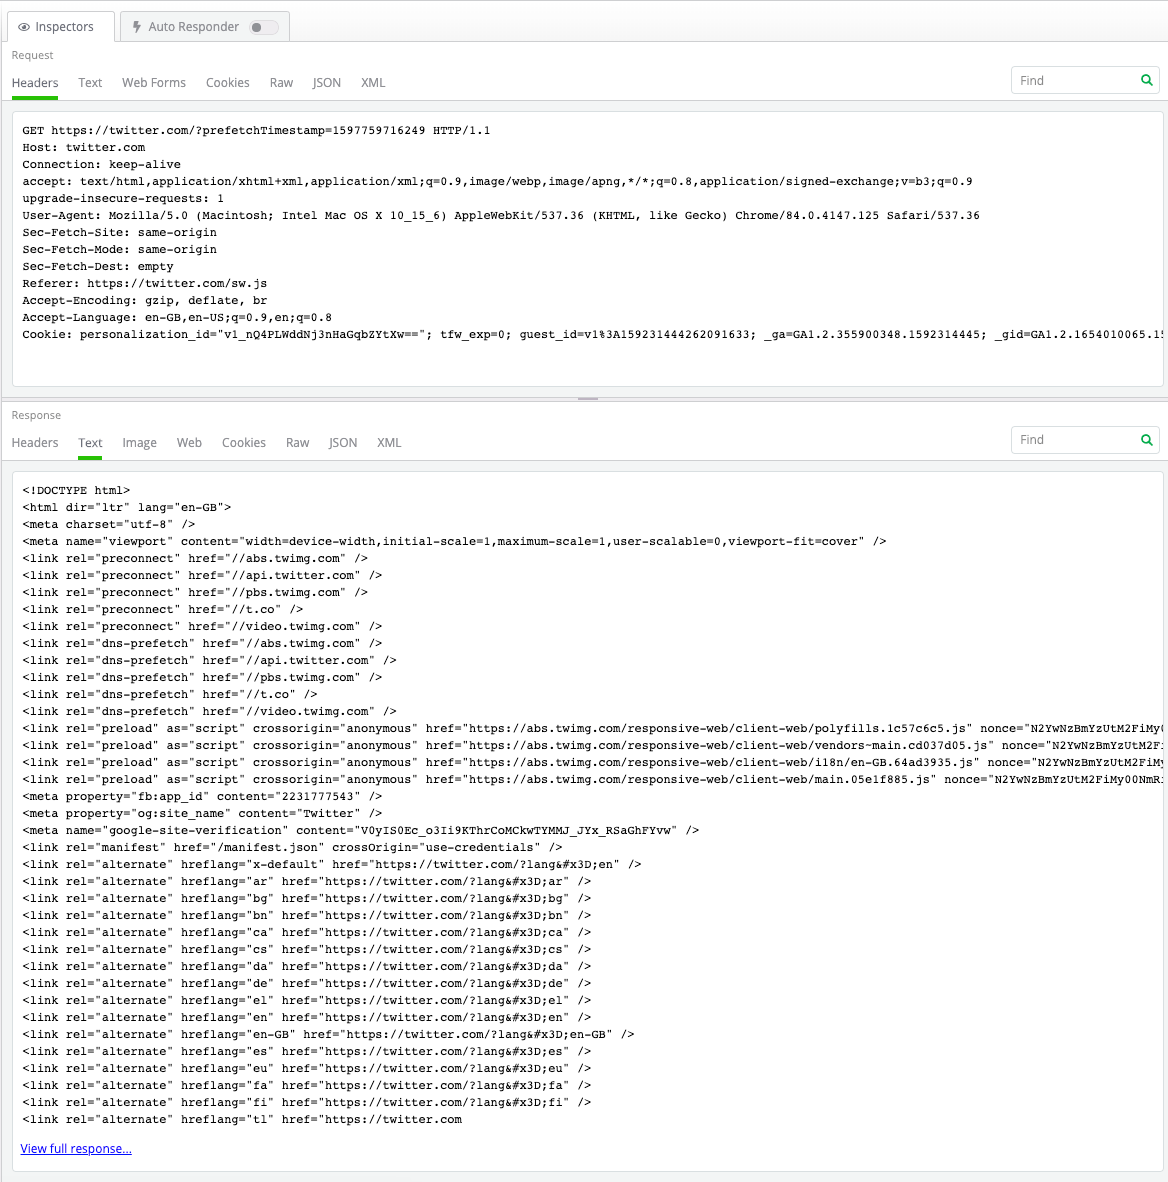
On selecting a web session by clicking on it, Fiddler Everywhere loads the data in the Traffic Inspector tab on the right. The Request headers are present at the top, and the Response headers below.
Fiddler Everywhere has different types of Traffic Inspectors available, which can be used based on the content's format. You can switch the Inspectors by merely clicking on the required tab. Some of the available Inspectors in Fiddler Everywhere include:
- Headers
- Text
- Raw
- JSON
- XML
- Cookies
- Web Forms (Request only)
- Image (Response only)
- Web (Response only)
Headers Inspector
The Headers traffic inspector in Fiddler Everywhere helps you see all the HTTP headers sent and received by the Request and Response, respectively. The inspector indicates the HTTP method (GET) used, the URL requested (www.example.com/page.html), the HTTP version (HTTP/1.1), and the response status code (200 OK).
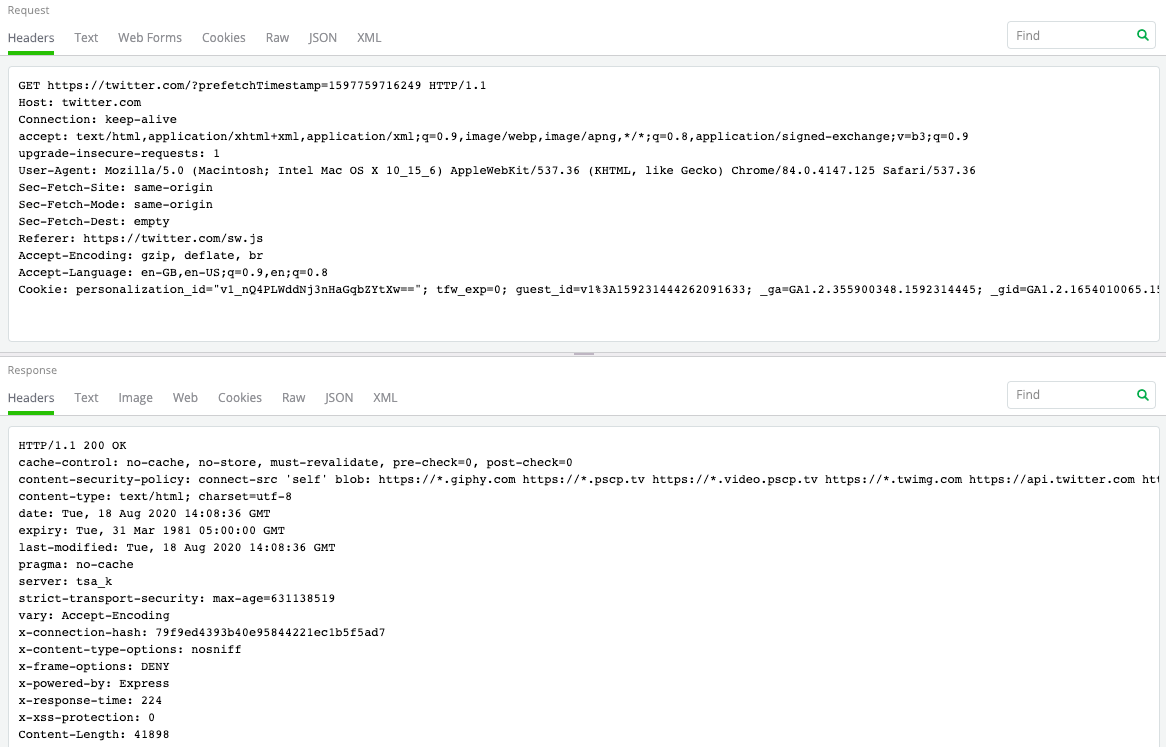
Fiddler Everywhere captures four types of headers:
- General headers: This usually has data not directly related content. Depending on the context, it is present in the Request or the Response. Example: Date, Connection.
- Request headers: This contains specific information about the data requested, or the about the client requesting the data. Example: Accept, User-Agent.
- Response headers: These carry information about the Response, or the server providing the Response. Example: Age, Server.
- Entity headers: These contain information about the body of the data requested or fetched. These are present in both the Request and the Response. Example: Content-Length, Content-Encoding.
Text Inspector
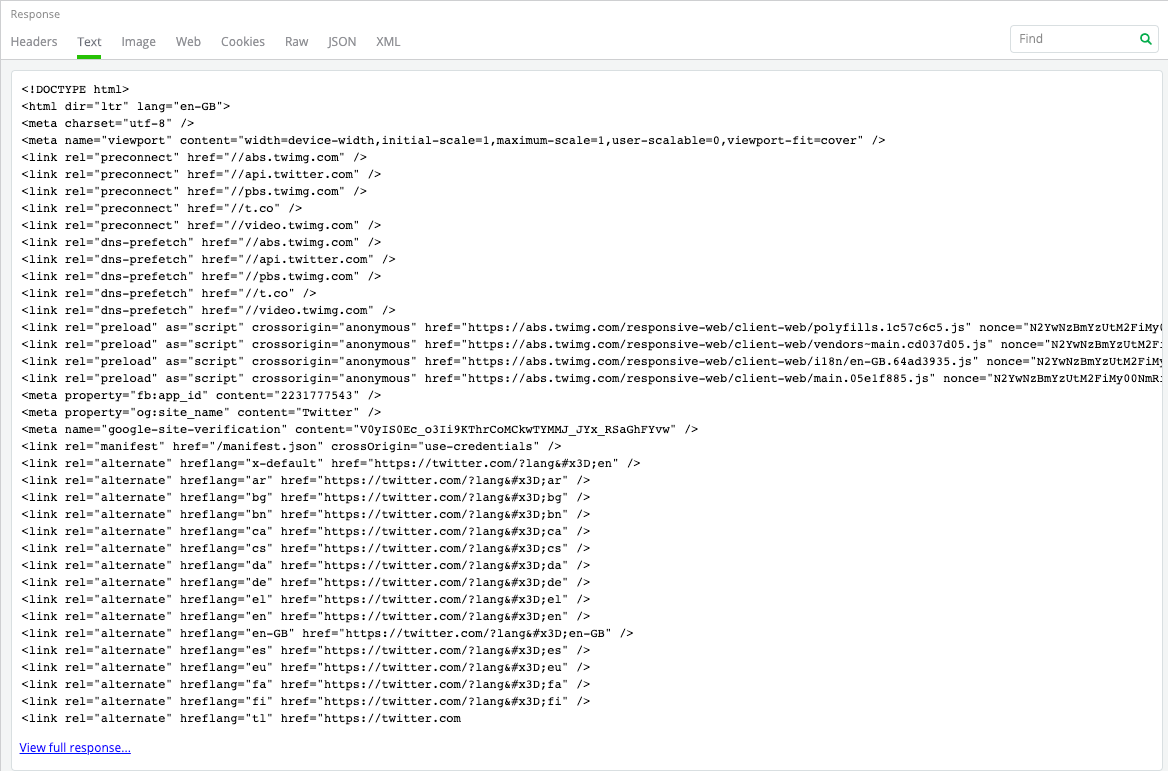
The Text Inspector in Fiddler Everywhere allows you to view the body present in the Request and Response as text. Fiddler Everywhere automatically interprets the text using the character set identified in the headers, the byte-order-mark (BOM), or a META tag.
Raw Inspector
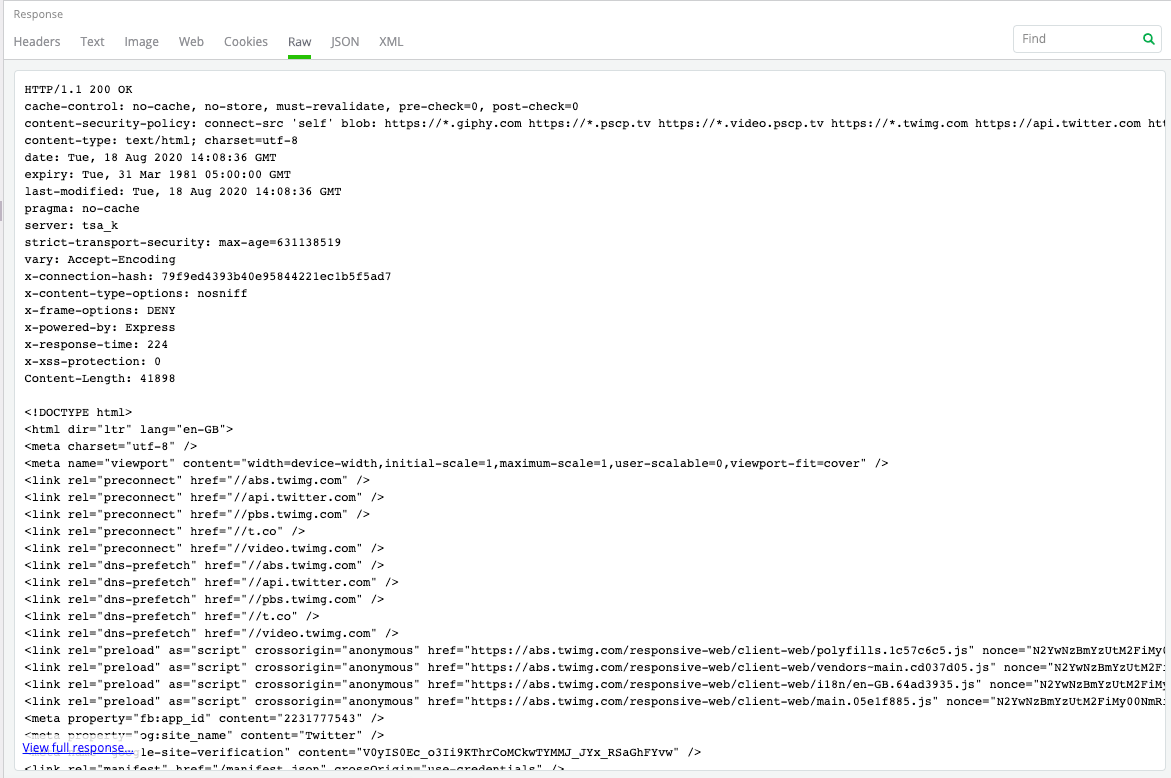
The Raw Inspector in Fiddler Everywhere provides the entire Request and Response as plain text. The text also includes the headers and body of the content.
JSON Inspector
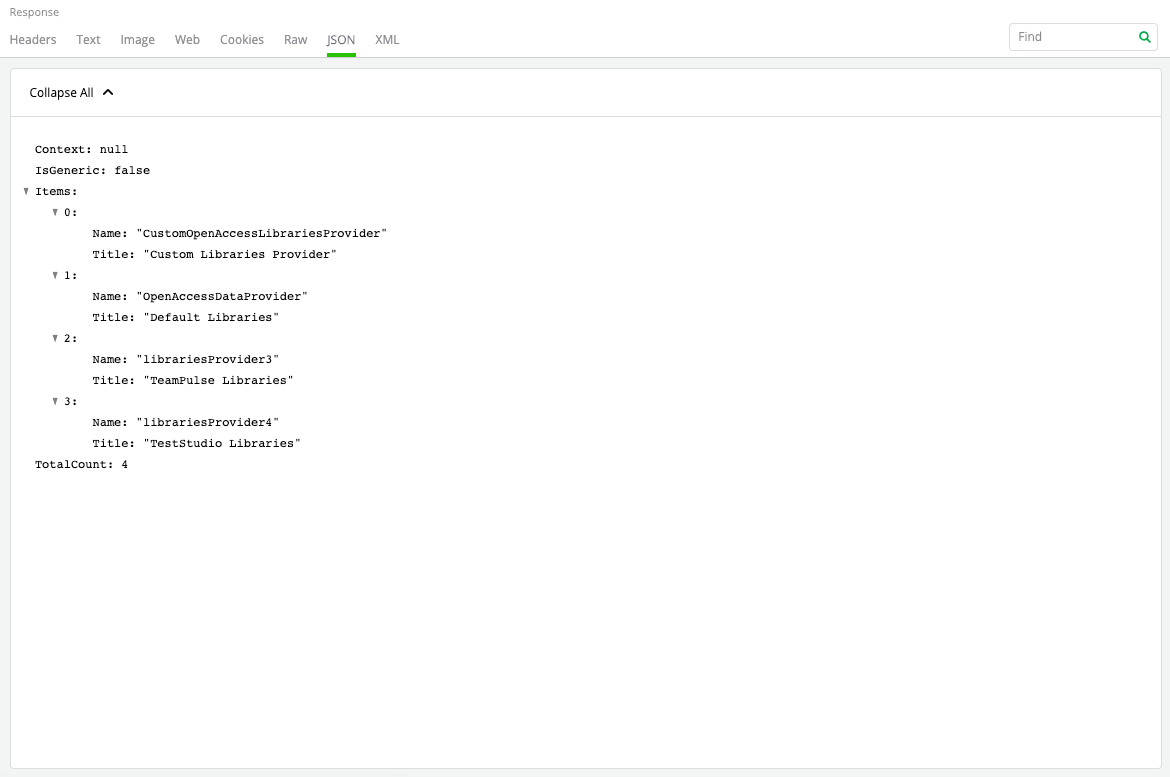
The JSON Inspector in Fiddler Everywhere interprets the body as a JavaScript Object Notation (JSON) formatted string. It also shows a tree view of the object nodes, which can be expanded and collapsed, as required.
XML Inspector
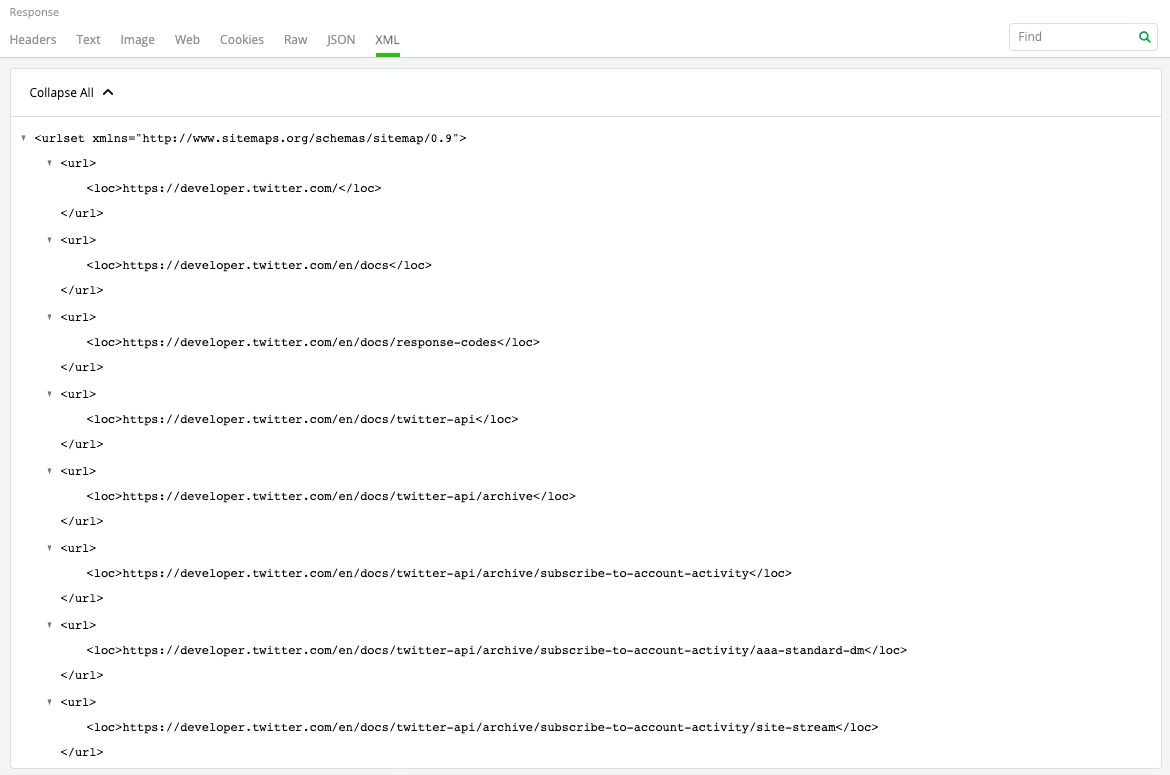
The XML Inspector in Fiddler Everywhere interprets the body as an Extensible Markup Language (XML). It also shows a tree view of the object nodes, with the attributes of the element displayed in square brackets.
Cookie Inspector
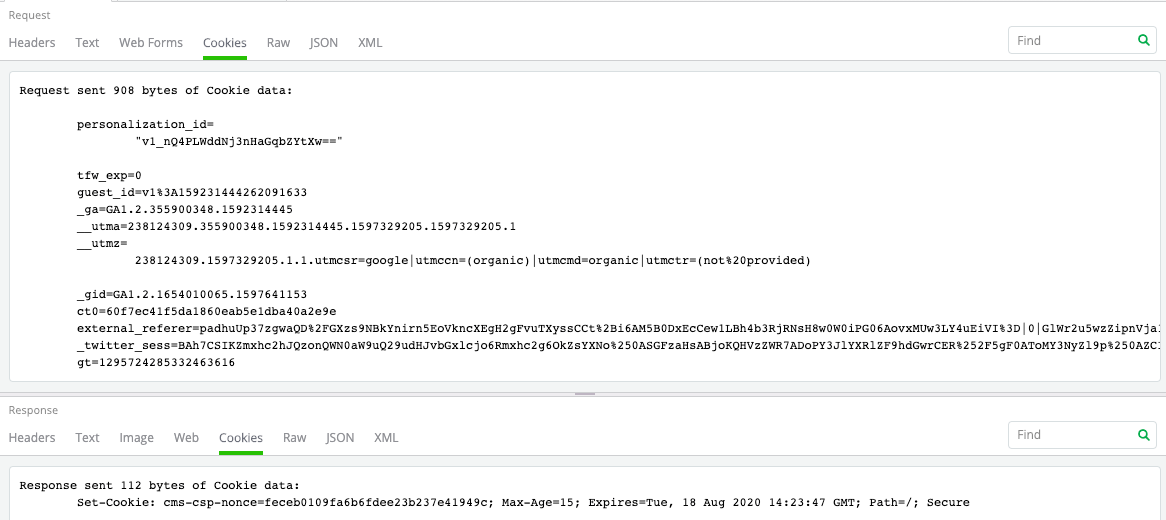
The Cookie Inspector in Fiddler Everywhere enables you to inspect the Cookie content sent in the Request and the Set-Cookie content received in the Response. Additionally, it also shows the size of the cookies sent and received, and the P3P response headers, if any.
Web Forms Inspector

Fiddler Everywhere automatically detects forms and parses it for HTML form-data. The query string and the body is available as name-value pairs in the Web Forms Inspectors. Since this accepts only the request query, it is available only for the Request.
Image Inspector

Fiddler Everywhere provides an image inspector that lets you view the image responses within the tool. The inspector supports a wide variety of formats, including JPEG, PNG, GIF, WebP, and TIFF.
Web Inspector

The Web Inspector in Fiddler Everywhere allows you to view the Response as a web page directly in the tool. This inspector lets you get a quick preview of the webpage that you are inspecting without having to check the browser. However, the web browser control prevents additional downloads when rendering the Response, so all functionalities may not work within the control view.
Get Fiddler Everywhere
Now that you know how robust Fiddler Everywhere is to capture and inspect network traffic, go ahead and try it out. Fiddler Everywhere is available on Windows, macOS, and Linux and supports every browser.

Jonathan Pereira
Jonathan Pereira was a senior developer advocate at Progress.
