Getting Started with RadPdfProcessing in Telerik UI for WinForms
Summarize with AI:
RadPdfProcessing allows you to create pdf files that contain text, images and any kind of custom shapes. You can export this document, protect it with a password and import it back.
This example will show you how to create a document which displays information about some controls and their usage. (Theoretically we could have gotten this information using Telerik Analytcs.) Here is how our final report will look like:
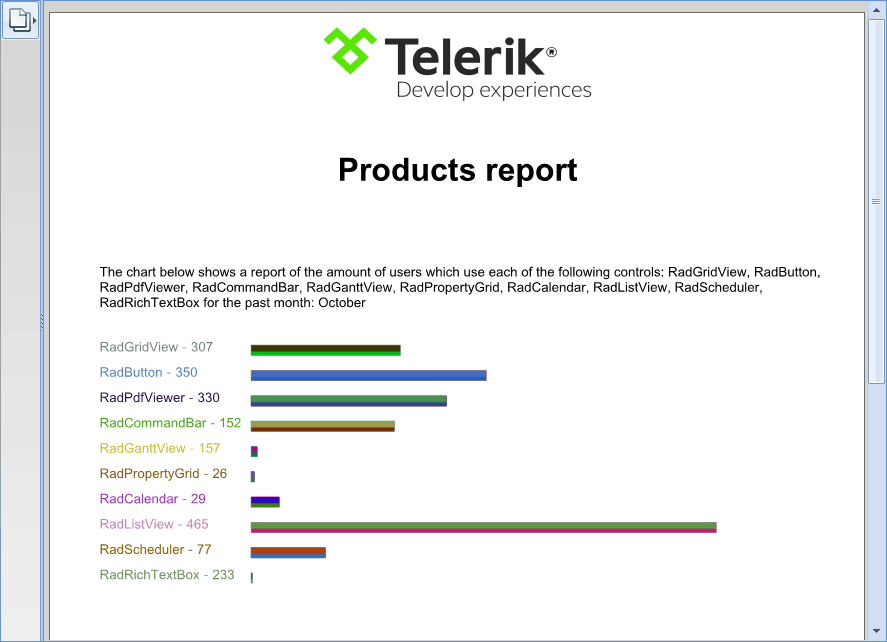
First thing's first. We need to create a WinForms project and add the assemblies of the RadPdfProcessing library, listed below (available in our Getting Started help article as well):
- Telerik.Windows.Documents.Core.dll
- Telerik.Windows.Documents.Fixed.dll
- Telerik.Windows.Zip.dll
You will also need to add a reference to WindowsBase, because the library uses some of the types in it.
Hint: The Telerik assemblies can be found in the installation of the UI for WinForms suite or in GAC and the WindowsBase is in the Assemblies -> Framework tab in the Reference Manager (the window which pops up after ‘Add reference’ is clicked)
If at this point, your project is building without errors. This means you have the needed references in place and we can proceed with writing some actual code. Since we will need data to work with, we can create a quick ReportGenerator, which will generate some random data for us. The model we are going to use will be called ControlUsage:
public class ControlUsage{ public string Name { get; set; } public int AmountOfUsers { get; set; }}public static class ReportGenerator{ private static Random random = new Random(); private static string[] availableControls = new string[] { "RadGridView", "RadButton", "RadPdfViewer", "RadCommandBar", "RadGanttView", "RadPropertyGrid", "RadCalendar", "RadListView", "RadScheduler", "RadRichTextBox" }; public static List<ControlUsage> Generate() { List<ControlUsage> report = new List<ControlUsage>(); for (int i = 0; i < availableControls.Length; i++) { report.Add(new ControlUsage { AmountOfUsers = random.Next(20, 500), Name = availableControls[i] }); } return report; }}
Nothing fancy here; just associating a random number with a string and putting it all into an object. Let’s head on to our form and generate some reports:
public Form1(){ InitializeComponent(); List<ControlUsage> report = ReportGenerator.Generate();}
Having our data, we need to put it in use. What better way than creating a class called ReportWriter. For now, we will declare some basic fields, properties and methods:
public class ReportWriter { private RadFixedDocument document; private FixedContentEditor editor; private Random random; public IList<ControlUsage> Report { get; private set; } public int VerticalItemsOffset { get; set; } public int HorizontalItemsOffset { get; set; } public int LeftPadding { get; set; } public ReportWriter(IList<ControlUsage> report) { this.Report = report; this.VerticalItemsOffset = 10; this.HorizontalItemsOffset = 10; this.LeftPadding = 50; this.random = new Random(); } public RadFixedDocument WriteToDocument() { this.document = new RadFixedDocument(); RadFixedPage page = this.document.Pages.AddPage(); this.editor = new FixedContentEditor(page); this.DrawLogo(); this.DrawHeading(); this.DrawText(); this.DrawChart(); return this.document; }}
What you can see is that it has a document and an editor. They will be used, along with the random generator (to create some pretty colors) in the process. The offsets will be used for spacing between items, and the WriteToDocument method will actually create the document by calling some private methods. You can also see that it is adding a page to the newly created document. This is the page we will be drawing on.
Maybe you noticed the missing methods: DrawLogo, DrawHeading, DrawText and DrawChart.
Okay, first the logo. For this we can use the Image help article in order to get the idea behind the images. Overall, we simply need to load our image into a stream, create an Telerik.Windows.Documents.Fixed.Model.Objects.Image object and add it to the page:
private void DrawLogo(){ System.Reflection.Assembly myAssembly = System.Reflection.Assembly.GetExecutingAssembly(); Stream myStream = myAssembly.GetManifestResourceStream("DplPdfProcessing.logo.png"); Telerik.Windows.Documents.Fixed.Model.Objects.Image image = new Telerik.Windows.Documents.Fixed.Model.Objects.Image(); image.ImageSource = new Telerik.Windows.Documents.Fixed.Model.Resources.ImageSource(myStream); image.Width = 300; image.Height = 100; image.Position.Translate(this.document.Pages.First().Size.Width / 2 - image.Width / 2, 0); this.document.Pages.First().Content.Add(image);}
Okay, that was easy. Let’s head to the next method–DrawHeading. Here, we are going to use a FixedContentEditor, which allows us to easily set different font, font size and alignment prior to drawing text. Also, before drawing anything with the editor, we must ensure that it is on the correct position. That is why we need to use the Translate method on its Position:
private void DrawHeading(){ using (this.editor.SaveProperties()) { Block textBlock = new Block(); textBlock.TextProperties.Font = FontsRepository.ZapfDingbats; textBlock.TextProperties.FontSize = 40; textBlock.HorizontalAlignment = Telerik.Windows.Documents.Fixed.Model.Editing.Flow.HorizontalAlignment.Center; string text = "Products report"; textBlock.InsertText(text); double x = (this.document.Pages.First().Size.Width / 2) - (textBlock.Measure().Width / 2); this.editor.Position.Translate(x, textBlock.Measure().Height + 100); editor.DrawBlock(textBlock); }}
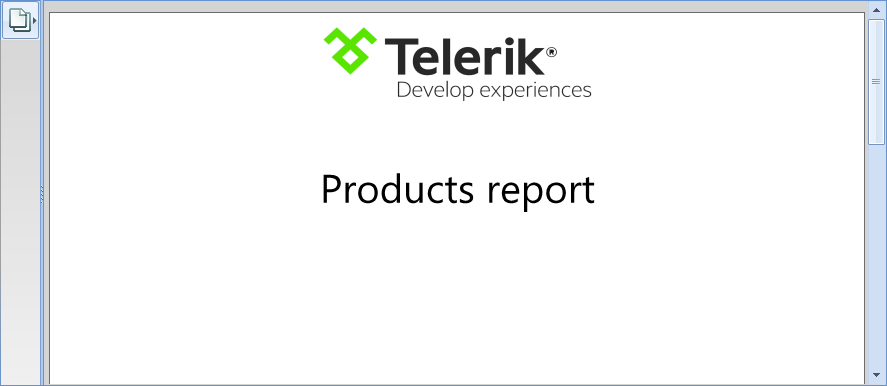
Afterward, we need to let the readers of the document know what they are actually looking at. So, let's add some text that clarifies the situation a bit. This is where our DrawText method comes into play:
private void DrawText(){ using (this.editor.SaveProperties()) { this.editor.Position.Translate(this.LeftPadding, 250); this.editor.TextProperties.Font = FontsRepository.HelveticaOblique; Block block = new Block(); this.editor.PushClipping(new Rect(this.document.Pages.First().Size)); string allControls = string.Join(", ", this.Report.Select(x => x.Name).ToArray()); string lastMonth = DateTime.Today.AddMonths(-1).ToString("MMMM", CultureInfo.InvariantCulture); string text = string.Format("The chart below shows a report of the amount of users which use each of the following controls: {0} for the past month: {1}", allControls, lastMonth); block.InsertText(text); this.editor.DrawBlock(block, new Size(this.document.Pages.First().Size.Width - this.LeftPadding, this.document.Pages.First().Size.Height)); this.editor.PopClipping(); //clipping is not preserved }}

Finally, before our report is ready, the actual chart must be created. Since this is the biggest part, I will split it. First, we need to know how big our chart will be. Here is how we will get its dimensions:
private Rect GetChartDimensions(Point start){ Block textBlock = new Block(); textBlock.InsertText(this.Report.First().Name); double textHeight = textBlock.Measure().Height; double chartHeight = (textHeight + this.VerticalItemsOffset) * this.Report.Count; double pageWidth = this.document.Pages.First().Size.Width; double chartWidth = pageWidth * 0.55; Point leftBottomPoint = new Point(start.X, start.Y + chartHeight); Point rightTopPoint = new Point(chartWidth + start.X, start.Y); Point rightBottomPoint = new Point(chartWidth + start.X, chartHeight + start.Y); Rect chartRect = new Rect(start, new Size(rightTopPoint.X - start.X, chartHeight)); return chartRect;}
Since the colors of the bars and the text will be different, we can use our Random object to generate them:
private RgbColor RandomRgbColor(){ return new RgbColor(this.RandomRgbValue(), this.RandomRgbValue(), this.RandomRgbValue());}private byte RandomRgbValue(){ return (byte)this.random.Next(0, 201);}
Now, we have our random color generator and we know how big our chart has to be. What’s left is to actually create it:
private void DrawChart(){ this.editor.TextProperties.Font = FontsRepository.Courier; double maxWidth = this.Report.Max(x => { Block block = new Block(); block.InsertText(x.Name); return block.Measure().Height; }); Point chartStartPoint = new Point(maxWidth, 250); Rect chartDimensions = this.GetChartDimensions(chartStartPoint); this.editor.Position.Translate(this.LeftPadding, 325); int maxValue = this.Report.Max(x => x.AmountOfUsers); Block textBlock = new Block(); textBlock.InsertText(this.Report.First().Name); double textHeight = textBlock.Measure().Height; double startX = 0; for (int i = 0; i < this.Report.Count; i++) { ControlUsage item = this.Report[i]; Block measureBlock = new Block(); measureBlock.InsertText(string.Format("{0} - {1}", item.Name, item.AmountOfUsers)); Size measuredSize = measureBlock.Measure(); startX = Math.Max(startX, measuredSize.Width); } for (int i = 0; i < this.Report.Count; i++) { this.DrawBarAndText(maxValue, textHeight, startX, this.Report[i]); }}private void DrawBarAndText(int maxValue, double textHeight, double startX, ControlUsage item){ string name = item.Name; RgbColor fillColor = this.RandomRgbColor(); Block textBlock = new Block(); this.editor.GraphicProperties.FillColor = fillColor; this.editor.GraphicProperties.StrokeColor = new RgbColor(fillColor.B, fillColor.G, fillColor.R); textBlock.GraphicProperties.CopyFrom(this.editor.GraphicProperties); textBlock.InsertText(string.Format("{0} - {1}", name, item.AmountOfUsers)); this.editor.DrawBlock(textBlock); Size measuredText = textBlock.Measure(); int width = item.AmountOfUsers - (maxValue % item.AmountOfUsers); this.editor.Position.Translate(this.editor.Position.Matrix.OffsetX + startX, this.editor.Position.Matrix.OffsetY); LinearGradient linearGradient = new Telerik.Windows.Documents.Fixed.Model.ColorSpaces.LinearGradient(new Point(0, 0), new Point(30, 30)); linearGradient.GradientStops.Add(new GradientStop(this.RandomRgbColor(), 0)); linearGradient.GradientStops.Add(new GradientStop(this.RandomRgbColor(), 1)); this.editor.GraphicProperties.FillColor = linearGradient; IPosition savedPosition = this.editor.Position.Clone(); this.editor.Position.Translate(0, this.editor.Position.Matrix.OffsetY); this.editor.DrawRectangle(new Rect(startX + this.HorizontalItemsOffset + this.LeftPadding, textHeight / 2, width, 10)); this.editor.Position = savedPosition; this.editor.Position.Translate(this.editor.Position.Matrix.OffsetX - startX, this.editor.Position.Matrix.OffsetY + measuredText.Height + this.VerticalItemsOffset);}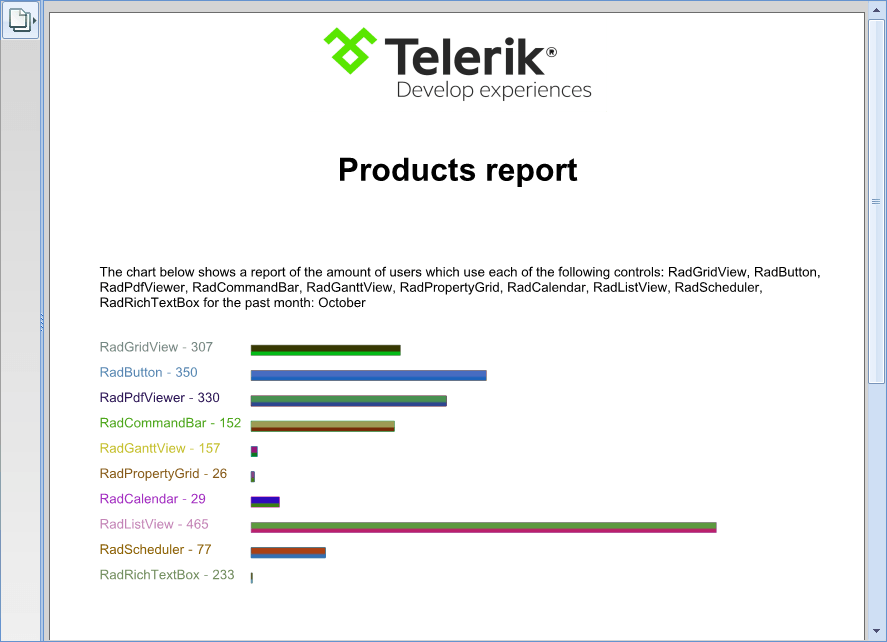
Now, you can save the file and open it with your favorite application.
List<ControlUsage> report = ReportGenerator.Generate();RadFixedDocument doc = new ReportWriter(report).WriteToDocument(); PdfFormatProvider provider = new PdfFormatProvider();using (FileStream fs = new FileStream("file.pdf", FileMode.Create)){ provider.Export(doc, fs);}
Okay, we have our file; however, we do not want to let everybody read our report, right? Luckily, RadPdfProcessing supports password protection. Here is how our code will look after the changes:
List<ControlUsage> report = ReportGenerator.Generate();RadFixedDocument doc = new ReportWriter(report).WriteToDocument();PdfFormatProvider provider = new PdfFormatProvider();PdfExportSettings exSettings = new PdfExportSettings();exSettings.IsEncrypted = true;exSettings.UserPassword = "MyStrongPassword";provider.ExportSettings = exSettings;using (FileStream fs = new FileStream("file.pdf", FileMode.Create)){ provider.Export(doc, fs);}
In case you need to import the protected document, you can read how here.
That’s it. You have a report generated in a pdf format that is ready for use.

Georgi Georgiev
Georgi Georgiev was a Support Officer at Telerik.
