New to Telerik UI for WPF? Start a free 30-day trial
Gap Length
Updated on Sep 23, 2026
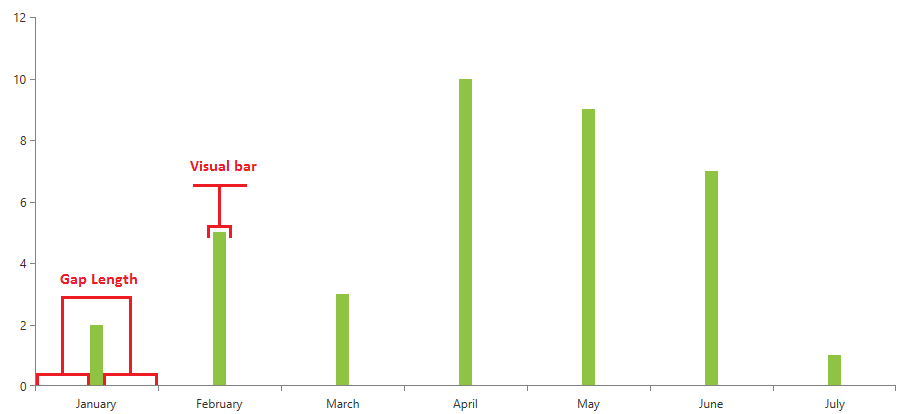
The CategoricalAxis and the DateTime axes (DateTimeCategoricalAxis and DateTimeContinuousAxis) expose a GapLength property which can be used to define what type of fraction of the category slot will be filled with the visual representation of the data point. This property expects a relative value between 0 and 1. For the purpose of this tutorial we will use BarSeries as the gap length can be easily observed.
Example 1 demonstrates that setting the GapLength to 0.90 value tells the gap to take 90% of the available space in the category slot. The other 10% will be taken by the bar visuals of the series.
Example 1: Setting the GapLength property
XAML
<telerik:RadCartesianChart Palette="Windows8">
    <telerik:RadCartesianChart.HorizontalAxis>
        <telerik:CategoricalAxis GapLength="0.90"/>
    </telerik:RadCartesianChart.HorizontalAxis>
    <telerik:RadCartesianChart.VerticalAxis>
        <telerik:LinearAxis />
    </telerik:RadCartesianChart.VerticalAxis>
    <telerik:RadCartesianChart.Series>
        <telerik:BarSeries>
            <telerik:BarSeries.DataPoints>
                <telerik:CategoricalDataPoint Category="January" Value="2" />
                <telerik:CategoricalDataPoint Category="February" Value="5" />
                <telerik:CategoricalDataPoint Category="March" Value="3" />
                <telerik:CategoricalDataPoint Category="April" Value="10" />
                <telerik:CategoricalDataPoint Category="May" Value="9" />
                <telerik:CategoricalDataPoint Category="June" Value="7" />
                <telerik:CategoricalDataPoint Category="July" Value="1" />
            </telerik:BarSeries.DataPoints>
        </telerik:BarSeries>
    </telerik:RadCartesianChart.Series>
</telerik:RadCartesianChart>