New to Telerik UI for WinForms? Start a free 30-day trial
Change the color of bar depending on the value
Updated on Sep 15, 2025
| Product Version | Product | Author |
|---|---|---|
| 2019.2.618 | RadGridView for WinForms | [Dimitar Karamfilov] |
Problem
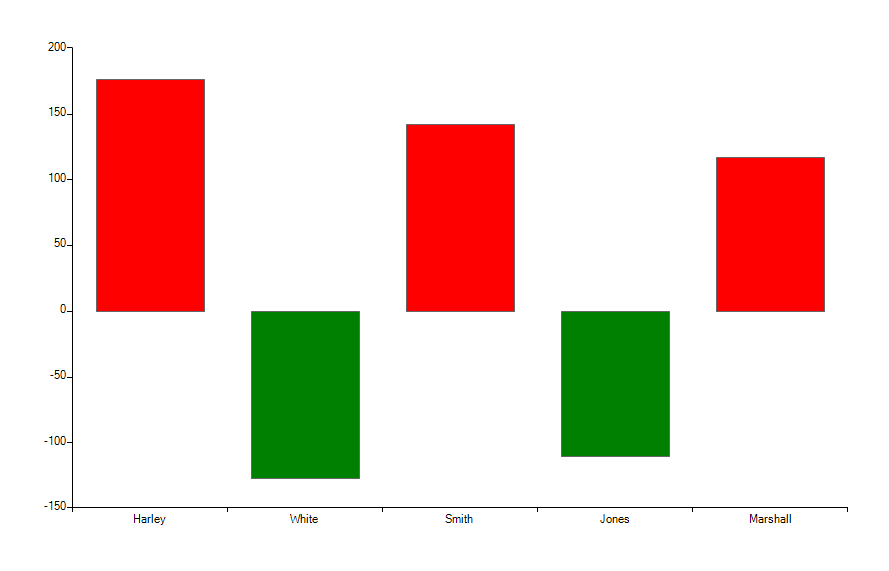
You need to set the BackColor of each bar chart depending on the DataPoint value.
Solution
Iterate the series children and set the color. This should be done after the chart is initialized. The following example sets the color of the values depending on their value.
C#
BarSeries barSeries = new BarSeries("Performance", "RepresentativeName");
barSeries.Name = "Q1";
barSeries.DataPoints.Add(new CategoricalDataPoint(177, "Harley"));
barSeries.DataPoints.Add(new CategoricalDataPoint(-128, "White"));
barSeries.DataPoints.Add(new CategoricalDataPoint(143, "Smith"));
barSeries.DataPoints.Add(new CategoricalDataPoint(-111, "Jones"));
barSeries.DataPoints.Add(new CategoricalDataPoint(118, "Marshall"));
this.radChartView1.Series.Add(barSeries);

foreach (BarPointElement item in radChartView1.Series[0].Children)
{
    var value = ((CategoricalDataPoint)item.DataPoint).Value;
    if (value.Value < 0)
    {
        item.BackColor = Color.Green;
    }
    else
    {
        item.BackColor = Color.Red;
    }

}