New to Telerik UI for WinForms? Start a free 30-day trial
Null Values Support
Updated on May 7, 2026
In RadSparkline the EmptyPointBehavior property controls what happens with null points. The possible values are:
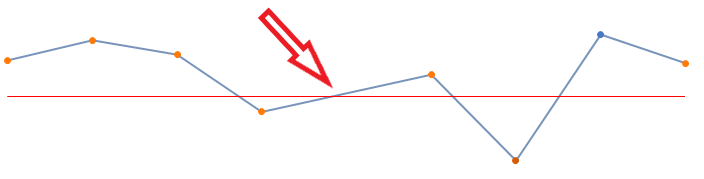
- ShowAsBlank: The null points would not be painted on the chart and a blank spot will appear.
- ShowAsZero: The null point will be considered as 0 on the Y axis.
- DoNotShow: The null point would not be painted on the chart.
C#
public void AddSeries()
{
    SparkLineSeries lineSeries = new SparkLineSeries();
    lineSeries.DataPoints.Add(new CategoricalSparkDataPoint(13));
    lineSeries.DataPoints.Add(new CategoricalSparkDataPoint(20));
    lineSeries.DataPoints.Add(new CategoricalSparkDataPoint(15));
    lineSeries.DataPoints.Add(new CategoricalSparkDataPoint(-5));
    lineSeries.DataPoints.Add(new CategoricalSparkDataPoint(null));
    lineSeries.DataPoints.Add(new CategoricalSparkDataPoint(8));
    lineSeries.DataPoints.Add(new CategoricalSparkDataPoint(-22));
    lineSeries.DataPoints.Add(new CategoricalSparkDataPoint(22));
    lineSeries.DataPoints.Add(new CategoricalSparkDataPoint(12));
    lineSeries.ShowMarkers = true;
    lineSeries.ShowHighPointIndicator = true;
    lineSeries.ShowLowPointIndicator = true;
    radSparkline1.Series = lineSeries;
    CartesianSparkGridLineAnnotation annotation1 = new CartesianSparkGridLineAnnotation();
    annotation1.Axis = this.radSparkline1.Axes[1] as SparkCartesianAxis;
    annotation1.Value = 0;
    annotation1.BorderColor = Color.Red;
    annotation1.BorderDashStyle = DashStyle.Solid;
    annotation1.BorderWidth = 1;
    this.radSparkline1.Annotations.Add(annotation1);
}Figure 1: ShowAsBlank
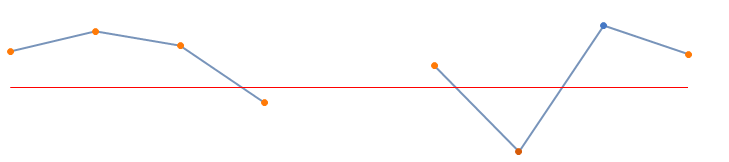
Figure 2: ShowAsZero
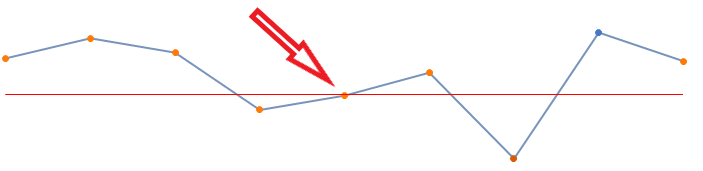
Figure 3: DoNotShow