Integration with RadChartView
RadChartView has full RadRangeSelector integration support, through implementation of the IRangeSelectorControl and IRangeSelectorElement interfaces by RadChartView and RangeSelectorViewElement classes respectively.
RangeSelectorViewElement supports only Cartesian series.
RangeSelectorViewElement extends the RadChartElement, draws the chart into RadRangeSelector and generates the scales according to its Axes collection. By accessing the RangeSelectorViewElement you can take advantage of some additional controlling mechanisms like SeriesInitializing, SeriesInitialized and LabelInitializng events. With the first two events you can control the series that should draw into RadRangeSelector and their types, while with the LabelInitializng event, you can control the labels that are going to be drawn on the scales.
Scale Customization
Here is how to access the RangeSelectorViewElement and change the series types:
SeriesInitializing Event
RangeSelectorViewElement chartElement = this.radRangeSelector1.RangeSelectorElement.AssociatedElement as RangeSelectorViewElement;
chartElement.SeriesInitializing += new SeriesInitializingEventHandler(chartElement_SeriesInitializing);Change Series Type
void chartElement_SeriesInitializing(object sender, SeriesInitializingEventArgs e)
{
    e.SeriesType = typeof(BarSeries);
}Figure 1: BarSeries
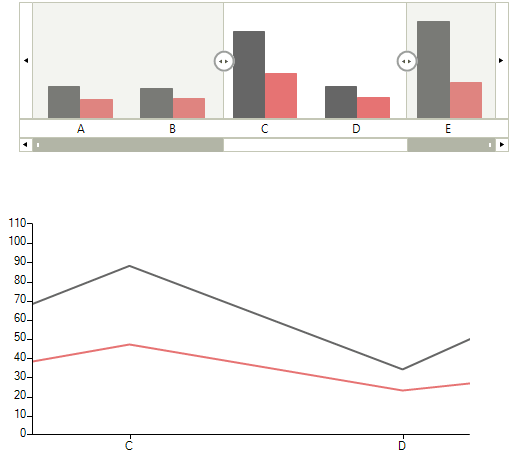
As you can see, the chart displays a LineSeries, while in RadRangeSelector we have changed it to BarSeries.
Labels Customization
Here is how to access and modify the labels in RadRangeSelector
LabelInitializing Event
RangeSelectorViewElement chartElement = this.radRangeSelector1.RangeSelectorElement.AssociatedElement as RangeSelectorViewElement;
chartElement.LabelInitializing += new LabelInitializingEventHandler(chartElement_LabelInitializing);Change Labels
Font f = new Font("Arial", 22);
void chartElement_LabelInitializing(object sender, LabelInitializingEventArgs e)
{
e.LabelElement.Font = f;
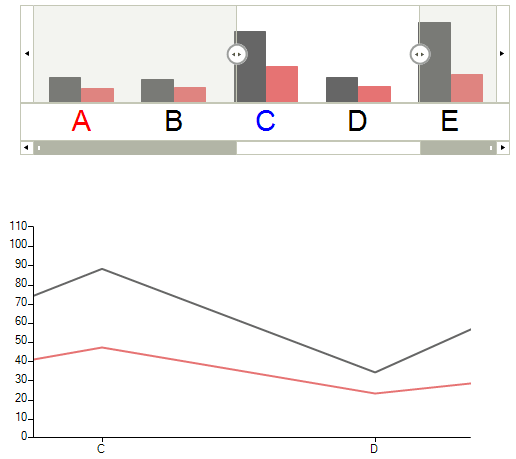
if (e.LabelElement.Text == "C")
{
e.LabelElement.ForeColor = Color.Blue;
}
if (e.LabelElement.Text == "A")
{
e.LabelElement.ForeColor = Color.Red;
}
}Figure 2: Changed Chart Labels
Also, the generated from RangeSelectorViewElement scales (RangeSelectorChartScaleContainerElement) have embedded logic that prevents overlapping of labels and the following properties can be used to control it:
-
ShowAllLabels: By default the control will hide the overlapping labels. If you want to show all labels, just set this property back to true.
-
LabelsOffset: This property defines the minimum space (in pixels) between the labels when ShowAllLabels is false. Default value of this property is 5 pixels.
The easiest way to access these properties is in the ScaleInitializing event of RandRangeSelector.
ScaleInitializing Event
this.radRangeSelector1.ScaleInitializing += new ScaleInitializingEventHandler(radRangeSelector1_ScaleInitializing);Label Settings
void radRangeSelector1_ScaleInitializing(object sender, ScaleInitializingEventArgs e)
{
    RangeSelectorChartScaleContainerElement chartScaleElement = e.ScaleElement as RangeSelectorChartScaleContainerElement;
    chartScaleElement.LabelsOffset = 0;
    chartScaleElement.ShowAllLabels = false;
}Pan and Zoom Synchronization
There is two-way synchronization between the pan and zoom functionality of RadChartView and the selected range of RadRangeSelector. By setting EnablePanAndZoomSynchronization property to false this synchronization will be only one way - from RadRangeSelector to RadChartView.
Disable Pan and Zoom Synchronization
((RangeSelectorViewElement)this.radRangeSelector1.RangeSelectorElement.AssociatedElement).EnablePanAndZoomSynchronization = false;