New to Telerik UI for WinForms? Start a free 30-day trial
Marked Zones
Updated over 1 year ago
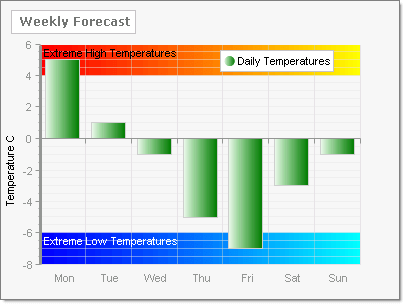
PlotArea MarkedZones are ranges that can be labeled and filled to highlight areas of the chart or to visually group data. The MarkedZones property by default display behind the chart series. You can create any number of members for the MarkedZones collection and each marked zone is defined by a starting and ending X and Y value pairs. You can also control the labeling and appearance for each zone independently.