New to Telerik UI for .NET MAUI? Start a free 30-day trial
Creating Custom Chart Palettes
Updated over 1 year ago
Environment
| Version | Product | Author |
|---|---|---|
| 10.0.0 | Chart for .NET MAUI | Dobrinka Yordanova |
Description
I want to change the default colors of the bar series in the CartesianChart. How can I achieve this?
This knowledge base article also answers the following questions:
- How can I use custom colors in the Telerik UI for .NET MAUI CartesianChart?
- How can I change the color on the CartesianChart
BarSeries?
Solution
The Chart supports the following default set of colors for displaying its data points:
#0078D4#EA005E#60CCFE#0093F9#00B7C3#FFB900#C239B3#6B69D6
To modify the default built-in colors, implement a custom palette, as demonstrated in the following scenario:
1. Create a sample DataModel:
C#
public class CategoricalData
{
    public object Category { get; set; }
    public double Value { get; set; }
}
2. Define the ViewModel class:
C#
public class ViewModel
{
public ViewModel()
{
this.Data1 = GetCategoricalData1();
this.Data2 = GetCategoricalData2();
this.Data3 = GetCategoricalData3();
}
public ObservableCollection<CategoricalData> Data1 { get; set; }
public ObservableCollection<CategoricalData> Data2 { get; set; }
public ObservableCollection<CategoricalData> Data3 { get; set; }
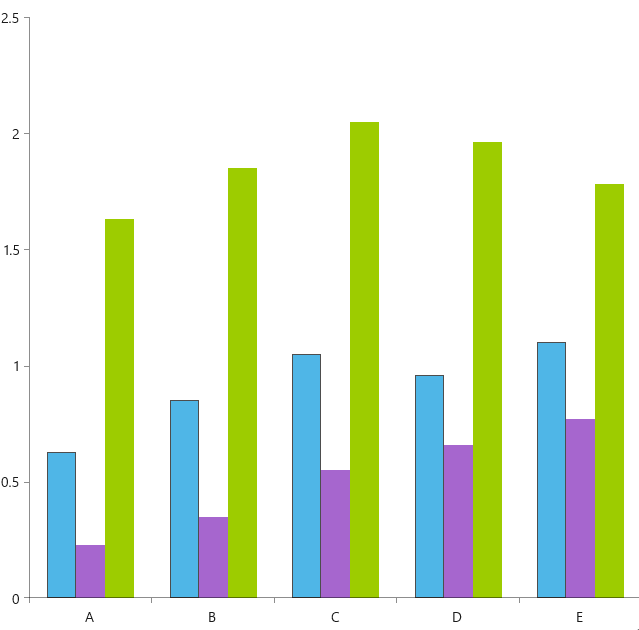
private static ObservableCollection<CategoricalData> GetCategoricalData1()
{
var data = new ObservableCollection<CategoricalData> {
new CategoricalData { Category = "A", Value = 0.63 },
new CategoricalData { Category = "B", Value = 0.85 },
new CategoricalData { Category = "C", Value = 1.05 },
new CategoricalData { Category = "D", Value = 0.96 },
new CategoricalData { Category = "E", Value = 1.1 },
};
return data;
}
private static ObservableCollection<CategoricalData> GetCategoricalData2()
{
var data = new ObservableCollection<CategoricalData> {
new CategoricalData { Category = "A", Value = 0.23 },
new CategoricalData { Category = "B", Value = 0.35 },
new CategoricalData { Category = "C", Value = 0.55 },
new CategoricalData { Category = "D", Value = 0.66 },
new CategoricalData { Category = "E", Value = 0.77 },
};
return data;
}
private static ObservableCollection<CategoricalData> GetCategoricalData3()
{
var data = new ObservableCollection<CategoricalData> {
new CategoricalData { Category = "A", Value = 1.63 },
new CategoricalData { Category = "B", Value = 1.85 },
new CategoricalData { Category = "C", Value = 2.05 },
new CategoricalData { Category = "D", Value = 1.96 },
new CategoricalData { Category = "E", Value = 1.78 },
};
return data;
}
}3. Define the RadCartesianChart in XAML:
XAML
<telerik:RadCartesianChart>
    <telerik:RadCartesianChart.BindingContext>
        <local:ViewModel />
    </telerik:RadCartesianChart.BindingContext>
    <telerik:RadCartesianChart.ChartBehaviors>
        <telerik:ChartSelectionBehavior DataPointSelectionMode="None"
                                    SeriesSelectionMode="Single" />
    </telerik:RadCartesianChart.ChartBehaviors>
    <telerik:RadCartesianChart.VerticalAxis>
        <telerik:NumericalAxis />
    </telerik:RadCartesianChart.VerticalAxis>
    <telerik:RadCartesianChart.HorizontalAxis>
        <telerik:CategoricalAxis LabelFitMode="MultiLine" />
    </telerik:RadCartesianChart.HorizontalAxis>
    <telerik:RadCartesianChart.Series>
        <telerik:BarSeries ValueBinding="Value"
                    CategoryBinding="Category"
                    CombineMode="Cluster"
                    ItemsSource="{Binding Data1}" />
        <telerik:BarSeries ValueBinding="Value"
                    CategoryBinding="Category"
                    CombineMode="Cluster"
                    ItemsSource="{Binding Data2}" />
        <telerik:BarSeries ValueBinding="Value"
                    CategoryBinding="Category"
                    CombineMode="Cluster"
                    ItemsSource="{Binding Data3}" />
    </telerik:RadCartesianChart.Series>
    <telerik:RadCartesianChart.Palette>
        <telerik:ChartPalette>
            <telerik:ChartPalette.Entries>
                <telerik:PaletteEntry FillColor="#4FB6E7" StrokeColor="#4FB6E7" />
                <telerik:PaletteEntry FillColor="#A666CE" StrokeColor="#A666CE" />
                <telerik:PaletteEntry FillColor="#9DCC00" StrokeColor="#9DCC00" />
            </telerik:ChartPalette.Entries>
        </telerik:ChartPalette>
    </telerik:RadCartesianChart.Palette>
    <telerik:RadCartesianChart.SelectionPalette>
        <telerik:ChartPalette>
            <telerik:ChartPalette.Entries>
                <telerik:PaletteEntry FillColor="#4FB6E7" StrokeColor="#4D4D4D" />
                <telerik:PaletteEntry FillColor="#A666CE" StrokeColor="#4D4D4D" />
                <telerik:PaletteEntry FillColor="#9DCC00" StrokeColor="#4D4D4D" />
            </telerik:ChartPalette.Entries>
        </telerik:ChartPalette>
    </telerik:RadCartesianChart.SelectionPalette>
</telerik:RadCartesianChart>
4. Add the telerik namespace:
XAML
xmlns:telerik="http://schemas.telerik.com/2022/xaml/maui"The following image shows the end result of the suggested implementation.