or
1 answer
123 views
I've noticed that there are some differences between several controls regarding watermark styling and left padding. It becomes quite visible if you put them next to each other. The left column only contains watermarkcontent and the right one contains text. I'm using the Windows7Theme but it looks the same in several other themes aswell.
<StackPanel Orientation="Horizontal"> <StackPanel Width="200" HorizontalAlignment="Left"> <telerik:RadWatermarkTextBox Margin="3" WatermarkContent="RadWatermarkTextBox"/> <telerik:RadAutoCompleteBox Margin="3" WatermarkContent="RadAutoCompleteBox"/> <telerik:RadMaskedTextInput HorizontalAlignment="Stretch" Margin="3" EmptyContent="RadMaskedTextInput" TextMode="PlainText"/> <telerik:RadComboBox IsEditable="True" Margin="3" EmptyText="RadComboBox"/> </StackPanel> <StackPanel Width="200" HorizontalAlignment="Left"> <telerik:RadWatermarkTextBox Margin="3" Text="RadWatermarkTextBox"/> <telerik:RadAutoCompleteBox Margin="3" SearchText="RadAutoCompleteBox"/> <telerik:RadMaskedTextInput HorizontalAlignment="Stretch" Margin="3" Value="RadMaskedTextInput" TextMode="PlainText"/> <telerik:RadComboBox IsEditable="True" Margin="3" Text="RadComboBox"/> </StackPanel></StackPanel>
Dinko | Tech Support Engineer
Telerik team

answered
on
04 Nov 2016
4 answers
406 views
I'm developing a bar chart where when the label is selected I need to set the color of that label as well as call an event handler (a different one than what I have set up for the bar selection).
Is there a property that enables this, similar to the ChartSelectionBehavior? Starting with one of the examples I found (see XAML below) I've been able to get the bar selection working and I made the label change color on mouse over, but this isn't what I need - it needs to function more like the bar selection.
<UserControl x:Class="TelerikChartDemo.ChartUserControl2" xmlns:chart="clr-namespace:Telerik.Windows.Controls;assembly=Telerik.Windows.Controls.Chart" xmlns:charting="clr-namespace:Telerik.Charting;assembly=Telerik.Windows.Controls.Chart" xmlns:chartView="clr-namespace:Telerik.Windows.Controls.ChartView;assembly=Telerik.Windows.Controls.Chart" xmlns:telerik="http://schemas.telerik.com/2008/xaml/presentation" xmlns:local="clr-namespace:TelerikChartDemo" mc:Ignorable="d" d:DesignHeight="300" d:DesignWidth="300"> <UserControl.DataContext> <local:PerformanceViewModel /> </UserControl.DataContext> <UserControl.Resources> <Style x:Key="ItemLabelStyle" TargetType="TextBlock"> <Setter Property="Padding" Value="4"/> <Setter Property="Background" Value="LightBlue" /> <Setter Property="Foreground" Value="Black" /> <Style.Triggers> <Trigger Property="IsMouseOver" Value="True"> <Setter Property="Background" Value="Black" /> <Setter Property="Foreground" Value="White" /> <!--<Setter Property="FontSize" Value="13.333" /> <Setter Property="FontWeight" Value="Bold" />--> </Trigger> </Style.Triggers> </Style> </UserControl.Resources> <Grid> <Grid.ColumnDefinitions> <ColumnDefinition Width="6*" /> <ColumnDefinition Width="*" /> </Grid.ColumnDefinitions> <chart:RadCartesianChart x:Name="RadCartesianChart" Palette="Windows8" Margin="0,18,0,0"> <telerik:RadCartesianChart.Behaviors> <telerik:ChartSelectionBehavior DataPointSelectionMode="Single" SelectionChanged="ChartSelectionBehavior_Changed" /> </telerik:RadCartesianChart.Behaviors> <chartView:BarSeries ItemsSource="{Binding Q1}" ValueBinding="Performance" CategoryBinding="RepresentativeName" ShowLabels="{Binding ShowLabels, Mode=TwoWay}" CombineMode="{Binding BarCombineMode, Mode=TwoWay}" FontFamily="Segoe UI" FontSize="10"> </chartView:BarSeries> <chart:RadCartesianChart.HorizontalAxis> <chartView:CategoricalAxis FontFamily="Segoe UI" FontSize="12" GapLength="{Binding GapLength}" /> </chart:RadCartesianChart.HorizontalAxis> <chart:RadCartesianChart.VerticalAxis> <chartView:LinearAxis FontFamily="Segoe UI" FontSize="12" Title="{Binding AxisTitle}" Minimum="0" Maximum="{Binding AxisMaxValue}" LabelFormat="{Binding AxisLabelFormat}" /> </chart:RadCartesianChart.VerticalAxis> </chart:RadCartesianChart> </Grid></UserControl>

2 answers
121 views
Hello,
dnd between two gridviews is not working since the upgrade from 2016.3.914.45 to 2016.3.1024.45.
In the OnDragInitialize methode I'm assigning a DnD object to eventargs.Data which is not recognized by the drop table "eventargs.Data.GetDataPresent()".
It worked perfectly in the previous version but caused yesterday a lot of trouble after upgrading an application to the latest version :(
private void OnDragInitialize(object sender, Telerik.Windows.DragDrop.DragInitializeEventArgs ea) {
string displayText = "";
var selectedRows = ((RadGridView)sender).SelectedItems;
if (selectedRows.Count == 0) {
return;
}
var list = new List<PsCore.DataObjects.DragAndDrop.BusinessPartnerEntityDndDO>();
foreach (PsCore.Interfaces.IDndDataObject row in selectedRows) {
list.Add(new PsCore.DataObjects.DragAndDrop.BusinessPartnerEntityDndDO(row.PrimaryID, row.DisplayText));
displayText = row.DisplayText;
}
ea.Data = new PsCore.DataObjects.DragAndDrop.DndContainerDO<PsCore.DataObjects.DragAndDrop.BusinessPartnerEntityDndDO>(list, displayText);
ea.DragVisual = new ContentControl { ContentTemplate = LayoutRoot.Resources["DraggedItemTemplate"] as DataTemplate, Content = ea.Data };
this.dragVisualTemp = ea.DragVisual;
ea.DragVisualOffset = new Point(ea.RelativeStartPoint.X, ea.RelativeStartPoint.Y - 20);
ea.AllowedEffects = DragDropEffects.All;
ea.Handled = true;
}
private bool IsDndObjectAllowed(DragEventArgs ea) {
Type dndContainerType = typeof(DndContainerDO<BusinessPartnerEntityDndDO>);
if (!ea.Data.GetDataPresent(dndContainerType)) {
Console.WriteLine("DND object NOT recognized");
return false;
}
var draggedData = (ea.Data as DataObject).GetData(dndContainerType) as DndContainerDO<BusinessPartnerEntityDndDO>;
if ((draggedData != null) && (draggedData.Items.GetType() == typeof(List<BusinessPartnerEntityDndDO>))) {
return true;
}
return false;
}
Best Regards,
Raul

Ivan Ivanov
Telerik team
answered
on
03 Nov 2016
8 answers
154 views
Hello,
I want to add Windows8 and windows8theme to a RadGridView, but I cannot find this 2 themes.
I put other using this syntax
StyleManager.ApplicationTheme = new TransparentTheme();
I fount that WPF Controls have these themes:
Telerik WPF controls support the following themes:
Office_Black, Office_Blue, Office_Silver, Expression_Dark, Summer, Vista, Windows 7, Transparent, Windows8, Windows8Touch.
My version is 2012.1.326.40

Lance | Senior Manager Technical Support
Telerik team
answered
on
03 Nov 2016
1 answer
632 views
Hello,
i am trying to implement a command (LeftDoubleClick) from my view to viewmodel using mvvm pattern (without code behind and event).
I saw some samples but they don't work for me!
Please can someone tell me i i am making wrong?
xaml:
<telerik:RadGridView x:Name="radGridView" Margin="8" ItemsSource="{Binding Source={StaticResource DataSource}}" IsReadOnly="True" > <telerik:RadGridView.InputBindings> <MouseBinding Gesture="LeftDoubleClick" helpers:AttachedMouseBinding.Command="{Binding Path=DoubleClickCommand}" /> </telerik:RadGridView.InputBindings> </telerik:RadGridView>
.cs:
public class UC_SEGridViewModel : InterfaceDescription.ViewModels.ViewModelBase{ private ViewModelMaster viewModelMaster; public ICommand DoubleClickCommand { get; set; } public UC_SEGridViewModel() { DoubleClickCommand = new RelayCommand(GridItemDoubleClick); } private void GridItemDoubleClick(object obj) { //do something }}but i don't reach my callback method (GridItemDoubleClick) when i set a breackpoint
the helper:
public class AttachedMouseBinding { const string PROPERTYNAMECOMMAND = "Command"; public static readonly DependencyProperty CommandProperty = DependencyProperty.RegisterAttached(PROPERTYNAMECOMMAND, typeof(ICommand), typeof(AttachedMouseBinding), new FrameworkPropertyMetadata(CommandChanged)); private static void CommandChanged(DependencyObject d, DependencyPropertyChangedEventArgs e) { FrameworkElement fe = d as FrameworkElement; ICommand command = e.NewValue as ICommand; InputBinding inputBinding = new InputBinding(command, new MouseGesture(MouseAction.LeftDoubleClick)); fe.InputBindings.Add(inputBinding); //if (inputBinding != null) // inputBinding.Command = command; } public static ICommand GetCommand(DependencyObject obj) { return (ICommand)obj.GetValue(CommandProperty); } public static void SetCommand(DependencyObject obj,ICommand value) { obj.SetValue(CommandProperty, value); } }
Thanks for your help,
Richard
Ivan Ivanov
Telerik team
answered
on
03 Nov 2016
0 answers
133 views
Hi,
I have a usercontrol which is set IsEnabled = "False". Hence the RadGridView in the usercontrol will be light grey color. I had set the some of the cell to be in red color. Is there any way to avoid grey color for RadGridView when usercontrol is disabled.
Thanks.
3 answers
1.2K+ views
i have table like
Id Name Age Sex Address
1 xxx 23 m yyyyyyyy
2 eee 24 f zzzzzzzzzz
So i want the name When i select the row , so please tell me ............
Lance | Senior Manager Technical Support
Telerik team
answered
on
02 Nov 2016
6 answers
539 views
Hi,
Is there any simple way to make whole RadGridView transparent?
I mean Headers, Rows, Vertical and Horizontal scrollbars, etc.
Setting "Background" property sets only data row area where no rows are created.
I am using 2015 Q3.
Thanks,
Łukasz
Stefan
Telerik team
answered
on
02 Nov 2016
5 answers
472 views
Hi,
on a form I have a pdfviewer and I need to know where the user click on my pdf. The coordinates should be relative to the document not the all radpdfviewer area.
When I get the coordinate with iTextSharp I'll put some image on that area (this part I'm already able to do it)
Those are the possibilities that I thought:
- Select an area on pdfviewer and get the coordinates? (THIS ONE WOULD BE THE BEST)
OR
- get the text selection position (I took a look to the documentation but I'm not able do reproduce the example.. this.PdfViewer.Document.CaretPosition is missing)
Any other idea?
Thank you

Deyan
Telerik team
answered
on
02 Nov 2016
2 answers
202 views
Hello,
lastly, we have updated our old version of Telerik to the newest one. Now we have a problem with the RadRibbonGroups.
When we minimize the mainwindow, the RibbonGroups collapse.
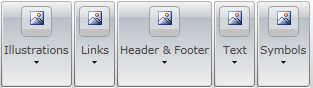 like these.
But in the old version of Telerik when the mainwindow was to small, two scrollbuttons appeared
on the left and right side of the RibbonView.
Is there any opportunity to use these two buttons in the newest version without collapsing groups?
thank you
Patrick
Top achievements
 Rank 1
answered
on
02 Nov 2016


