Hi,
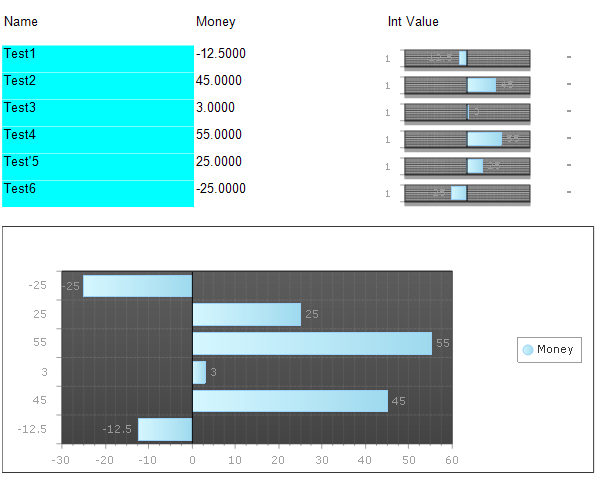
I was wondering if there is some way to place on each row a bar chart of a single value +/- from 0. Please forgive me as I am not familiar with charting terminology. A diagram might help with my intentions.
Row 1 -2 --|
Row 2 3 |---
Row 3 -4 ----|
Row 4 -1 -|
Row 5 5 |-----
etc.
I realize there isn't a lot to go on here but I hope my intentions are clear enough.
Cheers,
Clint