
kellyroberts
Top achievements
 Rank 1
kellyroberts
asked on 29 Apr 2010, 06:52 PM
I am trying to figure out how to calculate pergentages by subtotal. Using Product Sales Per Period Demo as an example...
2003 Bike Rack total is 134.9k and Total 2003 Accessories is 590.3k Id like to add a column next to 2003-Total called "2003 % to total" where id see something like ..134.9 / 590.3 = .2285 = 22.85%, so Bike Racks were 22.85% of Accessory Sales in 2003. and so on for each item in each group ...
Im not sure how exactly to do this in report writer. I think I could do it if I could bind an expression to a textbox in some particular group.
an expression something like ... = Fields.2003Sales / Report.Groups.AccessoriesGroupFooter.Textbox17.value
how can i acheive this ...
thanks in advance...
8 Answers, 1 is accepted
0


Hi kellyroberts,
There is no built-in way to access the "Category per Year" aggregate from an inner scope. Using the Exec function you may only access the "Category per all years" or "Year per all categories" scopes.
However there is a way to accomplish the task and it is to create a custom aggregate function that breaks down the "Category per all years" aggregate by years.
The approach is very similar to the one described in the blog post Dynamic Sorting of Reporting Crosstabs Using a Custom Aggregate Function.
Find attached a modified version of the Product Sales report fulfilling your requirement.
Also as this seems like a really useful case we will consider adding a built-in functionality allowing similar aggregations.
See also:
User Aggregate Functions
Sincerely yours,
Milen
the Telerik team
Do you want to have your say when we set our development plans? Do you want to know when a feature you care about is added or when a bug fixed? Explore the Telerik Public Issue Tracking system and vote to affect the priority of the items.
0
kellyroberts
Top achievements
Rank 1
answered on 04 May 2010, 06:27 PM
thanks Ill check it out.
0
kellyroberts
Top achievements
Rank 1
answered on 13 May 2010, 06:40 PM
=( ouch, example hurt brain.
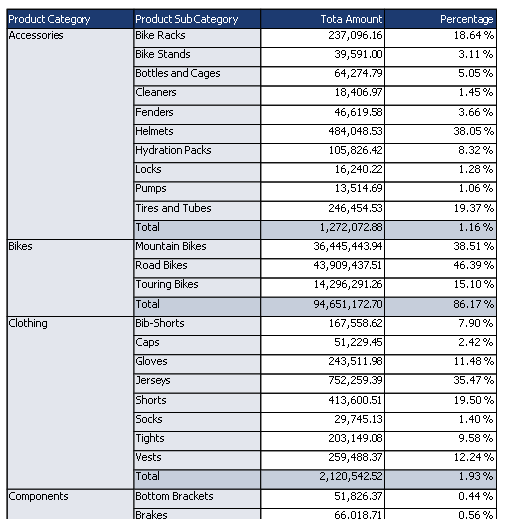
The effect of the example may have been the same but the context was different enough that I could not relate it to my problem. I think it was the crosstab that threw me. attached is a screenshot w/ a sample dataset. the dataset shows the kind of calculation I am trying to acheive.
keep in mind I am trying to do 2 things
1) a value in detail section that is a percent of group total
2) a value in group section that is a percent of grand total.
Is it possible to provide an example that shows how to accomplish this using the User Defined Aggregate approach you mentioned? or if you have any other suggestion on how to accomplish this please advise.
0
Hello kellyroberts,
The custom aggregate is needed only if you are slicing the data in each row by some field (Year for example) and you need percentages also sliced by this field, or in other words you have dynamic columns, as explained at the beginning of my last post.
In your case (as shown in the provided excel screenshot), you have only row groups that are dynamic, and the mentioned Exec function is perfect to implement this scenario.
Please find attached a sample report with the Exec function in action.
And here is the output:
Hope this information helps.
Best wishes,
Milen
the Telerik team
Do you want to have your say when we set our development plans? Do you want to know when a feature you care about is added or when a bug fixed? Explore the Telerik Public Issue Tracking system and vote to affect the priority of the items.
0
kellyroberts
Top achievements
Rank 1
answered on 17 May 2010, 02:57 PM
Hi Thanks for your reply. I am NOT using a crosstab. I am having trouble getting exec to work correctly. i am in a group section and I want to add an expression that calcs groupsum / reportsum ... something like this .
Sum(Fields.Percent) / Exec("Report1",Sum(Fields.Percent) where Report1 is the name of my report. I keep getting Invalid Scope error.
Sum(Fields.Percent) / Exec("Report1",Sum(Fields.Percent) where Report1 is the name of my report. I keep getting Invalid Scope error.
0
kellyroberts
Top achievements
Rank 1
answered on 17 May 2010, 03:45 PM
I tried this on a simplified report. I am having a problem getting the correct scope for the whole report.
I have a textbox in a group footer and Im trying to make an expression like ...
=sum(fields.totalweight) / Exec("Report1",sum(fields.totalweight)
this gives Invalid Scope "Report1" error
Report1 is the name of my report
again I am NOT using a crosstab.
please advise.
I have a textbox in a group footer and Im trying to make an expression like ...
=sum(fields.totalweight) / Exec("Report1",sum(fields.totalweight)
this gives Invalid Scope "Report1" error
Report1 is the name of my report
again I am NOT using a crosstab.
please advise.
0
Accepted

Hello kellyroberts,
Peter
the Telerik team
Do you want to have your say when we set our development plans? Do you want to know when a feature you care about is added or when a bug fixed? Explore the Telerik Public Issue Tracking system and vote to affect the priority of the items.
The missing scope errors is due to a omitted serialization of the Report's name. This is a known issue that has been logged to our bug tracking system. To avoid this error you have to change the Report name from the property grid or add this.Name = "Report1" in code behind after the InitializeComponent() line.
Please accept our apologies for the inconvenience.
Peter
the Telerik team
Do you want to have your say when we set our development plans? Do you want to know when a feature you care about is added or when a bug fixed? Explore the Telerik Public Issue Tracking system and vote to affect the priority of the items.
0
kellyroberts
Top achievements
Rank 1
answered on 19 May 2010, 02:27 PM
Hi Peter, Thanks for your reply.
Changing report name in the property did nothing as the name was already there BUT adding Me.Name = "Report1" after InitializeThingy() did the trick.
Regards,
Kelly Roberts
Changing report name in the property did nothing as the name was already there BUT adding Me.Name = "Report1" after InitializeThingy() did the trick.
Regards,
Kelly Roberts