
Jim Morris
Top achievements
 Rank 1
Jim Morris
asked on 08 Sep 2010, 06:53 PM
I am using the Q1 2010 version of Rad Pie Chart and am baffled as to how to get the control to stop adding decorative styles to the series items. It seems no matter what combination of PaletteBrushes, UseSolidWhatever, Theme, etc... it still adds some unwanted shading and outlining to my pie chart. I can customize the base color alright but the style remains the same. Just look at all the samples. Not just the pie chart. There is the same (themed?) style applied. How do I get rid of this, and sub question, how do I insert my own? Anyone got any ideas?
Tks - Jim
Tks - Jim
9 Answers, 1 is accepted
0

Hello Jim Morris,
You need to retemplate your Pie in order to change the mask over it (remove all XAML marked in yellow).
Here are all styles and resources you need:
Please take in consideration that the VisualStateManager concerns our interactivity which is available only for SL/WPF 4. If you use WPF 3.5 you need to remove that part of the template.
Add this lines in your code behind in order to apply the modified style:
Please try this and let us know if you need something else.
Kind regards,
Sia
the Telerik team
You need to retemplate your Pie in order to change the mask over it (remove all XAML marked in yellow).
Here are all styles and resources you need:
<RadialGradientBrush x:Key="PieMaskBrush" GradientOrigin="0.5,0.5"> <GradientStop Color="#33FFFFFF" Offset="0.88"/> <GradientStop Color="#00FFFFFF" Offset="0.65"/> <GradientStop Offset="0.89"/></RadialGradientBrush><Style x:Key="CustomPie" TargetType="telerikCharting:Pie"> <Setter Property="Template" > <Setter.Value> <ControlTemplate TargetType="telerikCharting:Pie"> <Canvas x:Name="PART_MainContainer"> <Ellipse Clip="{TemplateBinding FigurePath}" Width="{TemplateBinding ItemActualWidth}" Height="{TemplateBinding ItemActualHeight}" StrokeThickness="0" Style="{TemplateBinding ItemStyle}" /> <Path x:Name="PART_DefiningGeometry" Data="{TemplateBinding FigurePath2}" Fill="Transparent" Style="{TemplateBinding ItemStyle}"/> <Ellipse Clip="{TemplateBinding FigurePath3}" Fill="{StaticResource PieMaskBrush}" Width="{TemplateBinding ItemActualWidth}" Height="{TemplateBinding ItemActualHeight}" /> <Canvas.RenderTransform> <TransformGroup> <ScaleTransform x:Name="PART_AnimationTransform" ScaleX="0" ScaleY="0" /> <TranslateTransform x:Name="PART_ExplodeTransform" /> </TransformGroup> </Canvas.RenderTransform> <vsm:VisualStateManager.VisualStateGroups> <vsm:VisualStateGroup x:Name="HoverStates"> <vsm:VisualState x:Name="Normal"> <Storyboard> <DoubleAnimation To="1.0" Storyboard.TargetName="PART_MainContainer" Storyboard.TargetProperty="Opacity" Duration="0.00:00:00.15" /> </Storyboard> </vsm:VisualState> <vsm:VisualState x:Name="Hovered"> <Storyboard> <DoubleAnimation To="1.0" Storyboard.TargetName="PART_MainContainer" Storyboard.TargetProperty="Opacity" Duration="0.00:00:00.15" /> </Storyboard> </vsm:VisualState> <vsm:VisualState x:Name="Hidden"> <Storyboard> <DoubleAnimation To="0.15" Storyboard.TargetName="PART_MainContainer" Storyboard.TargetProperty="Opacity" Duration="0.00:00:00.15" /> </Storyboard> </vsm:VisualState> </vsm:VisualStateGroup> <vsm:VisualStateGroup x:Name="SelectionStates"> <vsm:VisualState x:Name="Unselected"> </vsm:VisualState> <vsm:VisualState x:Name="Selected"> <Storyboard> <ObjectAnimationUsingKeyFrames Storyboard.TargetName="PART_SelectedState" Duration="0.00:00:00.05" Storyboard.TargetProperty="Stroke"> <DiscreteObjectKeyFrame KeyTime="0.00:00:00.0"> <DiscreteObjectKeyFrame.Value> <SolidColorBrush Color="#B2000000" /> </DiscreteObjectKeyFrame.Value> </DiscreteObjectKeyFrame> </ObjectAnimationUsingKeyFrames> <ObjectAnimationUsingKeyFrames Storyboard.TargetName="PART_SelectedState" Duration="0.00:00:00.05" Storyboard.TargetProperty="StrokeThickness"> <DiscreteObjectKeyFrame KeyTime="0.00:00:00.0"> <DiscreteObjectKeyFrame.Value> <mscorlib:Double xmlns:mscorlib="clr-namespace:System;assembly=mscorlib">2</mscorlib:Double> </DiscreteObjectKeyFrame.Value> </DiscreteObjectKeyFrame> </ObjectAnimationUsingKeyFrames> </Storyboard> </vsm:VisualState> </vsm:VisualStateGroup> </vsm:VisualStateManager.VisualStateGroups> </Canvas> </ControlTemplate> </Setter.Value> </Setter></Style>Please take in consideration that the VisualStateManager concerns our interactivity which is available only for SL/WPF 4. If you use WPF 3.5 you need to remove that part of the template.
Add this lines in your code behind in order to apply the modified style:
DataSeries dataSeries = new DataSeries();dataSeries.Definition = new PieSeriesDefinition() { ItemStyle = this.Resources["CustomPie"] as Style };Please try this and let us know if you need something else.
Kind regards,
Sia
the Telerik team
Do you want to have your say when we set our development plans?
Do you want to know when a feature you care about is added or when a bug fixed?
Explore the
Telerik Public Issue Tracking
system and vote to affect the priority of the items
0
Jim Morris
Top achievements
Rank 1
answered on 10 Sep 2010, 06:46 PM
Thanks for the response.
When I use this template I don't get anything at all. Not sure what version of the chart dll you are using but when I open the Pie template in Blend I get something pretty different.
The version I am using is 2010.2.0812.40.
When I use this template I don't get anything at all. Not sure what version of the chart dll you are using but when I open the Pie template in Blend I get something pretty different.
<Style x:Key="PieStyle1" TargetType="{x:Type telerik:Pie}"> <Setter Property="Template"> <Setter.Value> <ControlTemplate TargetType="{x:Type telerik:Pie}"> <Canvas> <Canvas.RenderTransform> <ScaleTransform ScaleY="0" ScaleX="0"/> </Canvas.RenderTransform> <Ellipse Clip="{TemplateBinding FigurePath}" Height="{TemplateBinding ItemActualHeight}" Style="{TemplateBinding ItemStyle}" StrokeThickness="0" Width="{TemplateBinding ItemActualWidth}"/> <Path x:Name="PART_DefiningGeometry" Data="{TemplateBinding FigurePath2}" Fill="Transparent" Style="{TemplateBinding ItemStyle}"/> <Ellipse Clip="{TemplateBinding FigurePath3}" Height="{TemplateBinding ItemActualHeight}" Width="{TemplateBinding ItemActualWidth}"> <Ellipse.Fill> <RadialGradientBrush GradientOrigin="0.5,0.5"> <GradientStop Color="#33FFFFFF" Offset="0.88"/> <GradientStop Color="Transparent" Offset="0.65"/> <GradientStop Offset="0.89"/> </RadialGradientBrush> </Ellipse.Fill> </Ellipse> </Canvas> </ControlTemplate> </Setter.Value> </Setter> </Style>The version I am using is 2010.2.0812.40.
0
Hi Jim Morris,
Are you sure that you are using 2010.2.0812.40? The template which you sent us is almost the same as mine. Actually only the part concerning the VisualStateManager is missing. This happens if you use the 35 version: 2010.2.0812.35. There you cannot see the visual states because our Interactivity feature is not available for WPF 3.5.
Greetings,
Sia
the Telerik team
Do you want to have your say when we set our development plans?
Do you want to know when a feature you care about is added or when a bug fixed?
Explore the
Telerik Public Issue Tracking
system and vote to affect the priority of the items
0
Dhaval patel
Top achievements
Rank 1
answered on 01 Nov 2011, 02:20 PM
Hello,
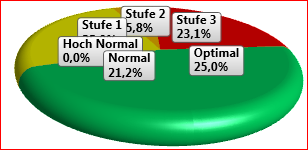
I am using Pie3DSeriesDefinition and want to ReTemplating.
I want this type of chart.
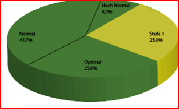
and by default it shown
So, please provide me example of 3DPie Template.
Thanks in advance.
Regards
Dhaval Patel.
I am using Pie3DSeriesDefinition and want to ReTemplating.
I want this type of chart.
and by default it shown
So, please provide me example of 3DPie Template.
Thanks in advance.
Regards
Dhaval Patel.
0
Dhaval patel
Top achievements
Rank 1
answered on 04 Nov 2011, 09:52 AM
Help!!! :(
0
Hi Dhaval Patel,
First of all, please excuse us for the late reply.
In order to get this look, you need to set a custom style as the one in the attached file (MyStyle). Please let me know whether this is what you want to achieve.
All the best,
Sia
the Telerik team
First of all, please excuse us for the late reply.
In order to get this look, you need to set a custom style as the one in the attached file (MyStyle). Please let me know whether this is what you want to achieve.
All the best,
Sia
the Telerik team
Explore the entire Telerik portfolio by downloading the Ultimate Collection trial package. Get it now >>
0
Dhaval patel
Top achievements
Rank 1
answered on 05 Nov 2011, 07:15 AM
Hello,
thanks for reply.
I have success to achieve style of Pie3D by your given example.
Thanks a lot. :)
thanks for reply.
I have success to achieve style of Pie3D by your given example.
Thanks a lot. :)
0
Subramaniam
Top achievements
Rank 1
answered on 07 Aug 2014, 08:21 AM
Hi Dhaval,
i required the complete sample application of #D telerik pie chart, Can you provide...
Thanks.
i required the complete sample application of #D telerik pie chart, Can you provide...
Thanks.
0

Hi Subramaniam,
I prepared a sample project with the style from the reply of my colleague Sia. Please give it a try and see if it works for you.
As a side note, keep in mind that the RadChart is our old charting component which currently is in maintenance mode (we no longer provide fixes and features for it). We introduced new RadChartView suite that resolves many known issues and limitations of the old chart. You can read about the differences between the controls in the RadChart vs. RadChartView help article. However, the RadChartView doesn't support 3D visualization. This is intended, because our data viz experience lead us to that displaying two dimensional data with 3D graph doesn't bring the end user better understanding of the data.
Please let us know if you need any further assistance.
Regards,
Martin
Telerik
Check out Telerik Analytics, the service which allows developers to discover app usage patterns, analyze user data, log exceptions, solve problems and profile application performance at run time. Watch the videos and start improving your app based on facts, not hunches.