
This is the current code and it is not working the way it does for bar charts, it is populating every date onto the graph and not aggregating itself according to months
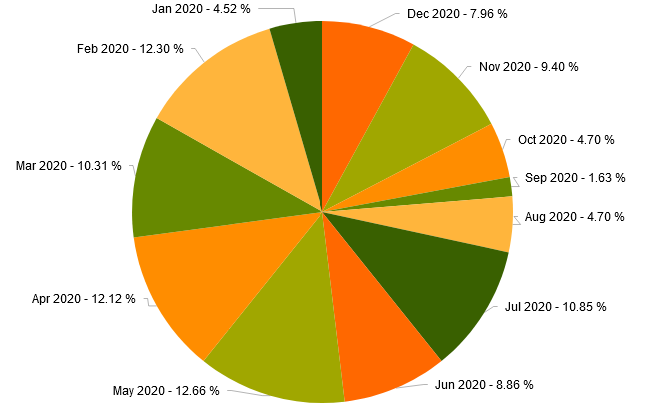
This is what I need it to look like:
series: [
                    {
                        type: "pie",
                        field: "value",
                        categoryField: "category",
                        aggregate: "sum",
                        padding: 10,
                        overlay: {
                            gradient: "none",
                        },
                        categoryAxis: {
                            baseUnit: "months",
                            maxDivisions: 5,
                            rangeLabels: {
                              visible: true,
                              format: "M"
                            },
                            labels: {
                              format: "d-M"
                            }
                        },]
