
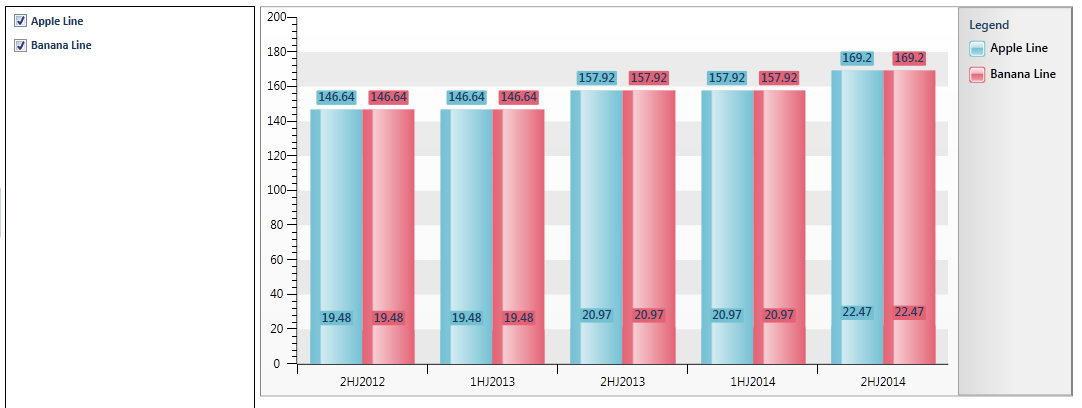
I need to some help regarding the chart. I need to show clustered bar chart and have to add series dynamically. Below is my code that builds the chart..
=======================================================================================================
List<ChartDispayView> lineResultsList = new List<ChartDispayView>();
locChart.SeriesMappings.Clear();
foreach (var line in vmRef.ChartLineMasterCollection)
{
if (line.IsChecked)
{
lineResultsList.AddRange(this.BuildLineViewChartData(line.LineName, vmRef.ChartResultsCollection.ToList()));
SeriesMapping sm = new SeriesMapping() { LegendLabel = line.LineName };
sm.ItemMappings.Add(new ItemMapping("PercentageLineOccupation", DataPointMember.YValue));
sm.ItemMappings.Add(new ItemMapping("Years", DataPointMember.XCategory));
sm.SeriesDefinition = new BarSeriesDefinition() { ShowItemLabels = true, ShowItemToolTips = true };
locChart.SeriesMappings.Add(sm);
}
}
locChart.ItemsSource = lineResultsList;
=======================================================================================================
It shouldn't create overwrite existing series.
Please guide me what i am doing wrong in the code and how to fix this issue.
Thanks
=======================================================================================================
List<ChartDispayView> lineResultsList = new List<ChartDispayView>();
locChart.SeriesMappings.Clear();
foreach (var line in vmRef.ChartLineMasterCollection)
{
if (line.IsChecked)
{
lineResultsList.AddRange(this.BuildLineViewChartData(line.LineName, vmRef.ChartResultsCollection.ToList()));
SeriesMapping sm = new SeriesMapping() { LegendLabel = line.LineName };
sm.ItemMappings.Add(new ItemMapping("PercentageLineOccupation", DataPointMember.YValue));
sm.ItemMappings.Add(new ItemMapping("Years", DataPointMember.XCategory));
sm.SeriesDefinition = new BarSeriesDefinition() { ShowItemLabels = true, ShowItemToolTips = true };
locChart.SeriesMappings.Add(sm);
}
}
locChart.ItemsSource = lineResultsList;
=======================================================================================================
It shouldn't create overwrite existing series.
Please guide me what i am doing wrong in the code and how to fix this issue.
Thanks
