Candle or OHLC Chart - Skip weekend or Skip No Data

1 Answer 79 Views
Chart
Naga
Top achievements
Rank 1
Naga asked on 14 Jun 2024, 08:57 PM | edited on 14 Jun 2024, 09:26 PM

Hello,

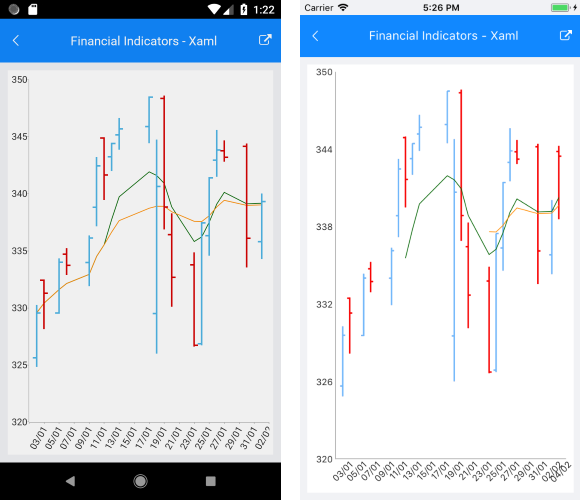
For Financial Charts i.e Candle or OHLC Chart - How to skip plot weekend or no date value in X Axes.

Looks like Telerik uses Datetime continuous axis so it shows weekend where there is no data in financial data series.

Basic need is not show weekend date on charts. How to skip ?


thanks

1 Answer, 1 is accepted

Sort by
0
Didi
Telerik team
answered on 17 Jun 2024, 09:56 AM

Hi Naga,

Chart shows the data that is passed to the series source. So if you want you can filter the collection first, so to be sure to remove the weekends and the data that has null values, then pass the collection to the chart control.

Hope this helps.

Naga
Top achievements
Rank 1
commented on 25 Jun 2024, 05:27 PM

Source doesn't have weekend data but as chart use Datetime continuous axis it is drawing the weekend is there any way not to use datetime continuous axis for financial charts

Even the examples of telerik you can see the gap data and chart

https://docs.telerik.com/devtools/maui/controls/chart/series/financial/ohlc-series

Below data has gaps i.e no 08-01-2011 and 09-01-2011.

   points.Add(new OhlcDataPoint(){ Category =  DateTime.ParseExact("04-01-2011", "dd-MM-yyyy", null), Open = 332.44, High = 332.50, Low = 328.15, Close = 331.29 });
        points.Add(new OhlcDataPoint(){ Category =  DateTime.ParseExact("06-01-2011", "dd-MM-yyyy", null), Open = 329.55, High = 334.34, Low = 329.50, Close = 334.00 });
        points.Add(new OhlcDataPoint(){ Category =  DateTime.ParseExact("07-01-2011", "dd-MM-yyyy", null), Open = 334.72, High = 335.25, Low = 332.90, Close = 333.73 });
        points.Add(new OhlcDataPoint(){ Category =  DateTime.ParseExact("10-01-2011", "dd-MM-yyyy", null), Open = 333.99, High = 336.35, Low = 331.90, Close = 336.12 });
        points.Add(new OhlcDataPoint(){ Category =  DateTime.ParseExact("11-01-2011", "dd-MM-yyyy", null), Open = 338.83, High = 343.23, Low = 337.17, Close = 342.45 });
        points.Add(new OhlcDataPoint(){ Category =  DateTime.ParseExact("12-01-2011", "dd-MM-yyyy", null), Open = 344.88, High = 344.96, Low = 339.47, Close = 341.64 });


Chart Financial Indicators

Didi
Telerik team
commented on 27 Jun 2024, 05:50 AM

Yes you can use the Categorical Axis -> https://docs.telerik.com/devtools/maui/controls/chart/axes/categorical-axis 

Here is an example:

<Grid>
    <telerik:RadCartesianChart PaletteName="Light" 
                    SelectionPaletteName="LightSelected"
                    BackgroundColor="White" >
        <telerik:RadCartesianChart.BindingContext>
            <local:SeriesOhlcViewModel />
        </telerik:RadCartesianChart.BindingContext>
        <telerik:RadCartesianChart.HorizontalAxis>
            <telerik:CategoricalAxis LineColor="#A9A9A9" 
                                    LabelFitMode="Rotate"
                                    PlotMode="BetweenTicks" />
        </telerik:RadCartesianChart.HorizontalAxis>
        <telerik:RadCartesianChart.VerticalAxis>
            <telerik:NumericalAxis LineColor="#A9A9A9" 
                        MajorTickBackgroundColor="#A9A9A9" />
        </telerik:RadCartesianChart.VerticalAxis>
        <telerik:RadCartesianChart.Series>
            <telerik:OhlcSeries CategoryBinding="Category"
                        OpenBinding="Open" 
                        HighBinding="High"
                        LowBinding="Low"
                        CloseBinding="Close"
                        ItemsSource="{Binding SeriesData}" />
        </telerik:RadCartesianChart.Series>
    </telerik:RadCartesianChart>
</Grid>

and the model data still uses the property 

public class OhlcDataPoint : NotifyPropertyChangedBase
{
    private DateTime category;
    private double open;
    private double high;
    private double low;
    private double close;
................


Tags
Chart
Asked by
Naga
Top achievements
Rank 1
Answers by
Didi
Telerik team
Share this question
or