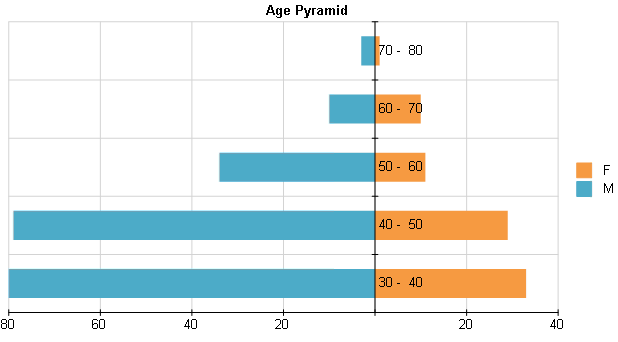
Check out the attached sample report definition I have used the AdventureWorks database, thus you may have to modify the connection string. Here are the required steps to setup age pyramid chart type:
From the Insert tab start the StackedBar Chart wizard;
Set up the datasource;
Set Gender field for Series;
Set Years field for Categories;
Set Count(Fields.Years) expression for Value;
Click Finish;
Now you have to make some changes with the Property Window;
Select the Graph Series and change the Series X value expression =Count(Fields.Years) to =IIF(Fields.Gender = "M", -Count(Fields.Years), Count(Fields.Years)) ;
Select the Graph X Axis and set the LabelFormat to {0:##;##} . This will remove the minus sign from the axis labels;
Optionally if you want the Y axis to show age ranges, you can change the CategoriesGroups (yearGroup1) Grouping expression as we have done.
All the best,
Peter
the Telerik team
Have you tried the new visualization options in Telerik Reporting Q1 2013? You can get them from your account.
Thanks, this helped me get a working example going fairly easily. I ended up using {0:#,#;#,#} for the LabelFormat option. This adds commas to the axis value labels.