Use Candlestick Chart and DataSource for iOS to Display JSON
Candlestick chart is a financial chart type, which is widely used to present price movements. It visualizes large amounts of data in a simple, readable way, enabling users to follow the price movements for the whole period or the current moment.
Each candlestick is described with four values–open, close, high and low and consists of body and an upper and a lower shadow.
If you want to dive into the art of the financial science and find out more about the candlestick charts, here is the magic explained.
From Theory to Practice–a Long Way to Go...or Not So Long
So far, we know the candlestick chart is convenient and useful, and we love it, but how do we implement it quickly, easily and without being a math star.
Don’t worry, the Telerik UI for iOS comes to the rescue! With the TKChart component, all we have to do is pass the data, and our chart will be ready--no math, not even a single calculation. I promise!
Simple Data Consumption
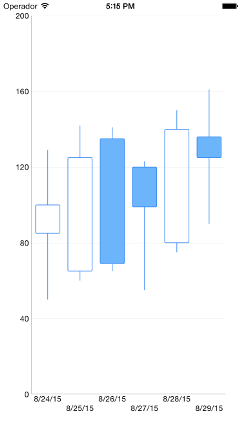
Let’s try it and generate some data for the chart.let openPrices = [100, 125, 69, 99, 140, 125]let closePrices = [85, 65, 135, 120, 80, 136]let lowPrices = [50, 60, 65, 55, 75, 90]let highPrices = [129, 142, 141, 123, 150, 161]var dateNow = NSDate()var financialDataPoints = [TKChartFinancialDataPoint]() for var i = 0; i < openPrices.count; ++i { var date = dateNow.dateByAddingTimeInterval(CDouble(60 * 60 * 24 * i)) financialDataPoints.append(TKChartFinancialDataPoint(x: date, open: openPrices[i], high: highPrices[i], low: lowPrices[i], close: closePrices[i]))}Now we have to create a TKChart, and add TKChartCandleStickSeries populated with our data.
let chart = TKChart(frame: CGRectInset(self.view.bounds, 15, 15))chart.autoresizingMask = UIViewAutoresizing.FlexibleWidth | UIViewAutoresizing.FlexibleHeightself.view.addSubview(chart) let candlestickSeries = TKChartCandlestickSeries(items: financialDataPoints)chart.addSeries(candlestickSeries) let xAxis = chart.xAxis as! TKChartDateTimeAxisxAxis.minorTickIntervalUnit = TKChartDateTimeAxisIntervalUnit.DaysxAxis.setPlotMode(TKChartAxisPlotMode.BetweenTicks)xAxis.majorTickInterval = 1Piece of cake!
Couple of lines of code, and we have a shiny candlestick chart.

Now, what if our data comes from a web service?
Consuming JSON Data from a WebService with TKDataSource
The result from the request usually comes in JSON format, so we have to get only the JSON objects we need, deserialize them and convert them to TKChartDataPoint objects. After that we can pass them to the chart. Managing all these operations is not a show stopper, but it would be much better if we could use one component to manage them all.
Fortunately, the TKDataSource component is here to make data management more convenient than ever. It is a non-visual component that consumes data from various sources, including web services. It also supports shaping operations such as sorting, filtering and grouping. Finally, it works perfectly with data-enabled visual controls.
We can use the TKDataSource combined with TKChart to get data from a web service, reshape it and visualize it.
First of all, we create a TKChart the same way we did it above.
let chart = TKChart(frame: CGRectInset(self.view.bounds, 20, 20))chart.autoresizingMask = UIViewAutoresizing.FlexibleWidth | UIViewAutoresizing.FlexibleHeightself.view.addSubview(chart)
Then we create the TKDataSource and set it up to get the data from the web service.
For this demo, I am going to use Yahoo! Finance APIs and get the stats of Progress Software Corporation between 10/03/2015 and 20/03/2015.
let dataSource = TKDataSource()let url = "http://query.yahooapis.com/v1/public/yql?q=select%20*%20from%20%20%20yahoo.finance.historicaldata%20%20%20%20%20%20%20%20%20where%20%20symbol%20%20%20%20=%20%22PRGS%22%20%20%20%20%20%20%20%20%20and%20%20%20%20startDate%20=%20%222015-03-10%22%20%20%20%20%20%20%20%20%20and%20%20%20%20endDate%20%20%20=%20%222015-03-20%22&format=json&diagnostics=true&env=store://datatables.org/alltableswithkeys&callback="dataSource.loadDataFromURL(url, dataFormat: TKDataSourceDataFormat.JSON, rootItemKeyPath: "query.results.quote") { (error:NSError!) -> Void in if(error != nil) { NSLog("Can't connect with the server") }}
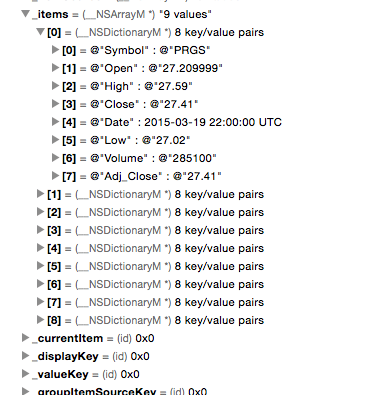
We got the JSON data, but the web service returns a bit more information than we need to populate our chart, so we specify that we want to deserialize only the objects in the query.results.quote path.
The dataSource object now contains a collection of the stats for each day the service has returned. As you can see they are deserialized and ready to use.

For your convenience, we are iterating over the items of the dataSource and are converting the Date property from NSString to NSDate. This is necessary to have our data visualized properly.
dataSource.map { (item:AnyObject!) -> AnyObject! in let dateFormatter = NSDateFormatter() dateFormatter.dateFormat = "yyyy-MM-dd" let date: NSDate = dateFormatter.dateFromString(item.valueForKey("Date") as! String)! item.setValue(date, forKey: "Date") return item}Now we have to tell the dataSource how to visualize the data.
In the createSeries method, we define the type of series the chart will be working with, in this case TKChartCandleStickSeries.
dataSource.map { (item:AnyObject!) -> AnyObject! in let dateFormatter = NSDateFormatter() dateFormatter.dateFormat = "yyyy-MM-dd" let date: NSDate = dateFormatter.dateFromString(item.valueForKey("Date") as! String)! item.setValue(date, forKey: "Date") return item}With the createPoint method, we get the data from each serialized item and convert it to a TKChartFinancialDataPoint object, which can be visualized by the Candlestick chart.
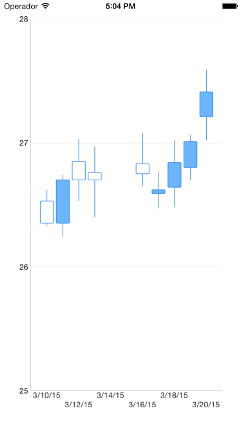
dataSource.settings.chart.createSeries { (group: AnyObject!) -> TKChartSeries! in let series = TKChartCandlestickSeries() return series} let formatter = NSNumberFormatter()formatter.numberStyle = NSNumberFormatterStyle.DecimalStyle dataSource.settings.chart.createPoint { ( seriesIndex:Int, dataIndex:Int, item:AnyObject!) -> TKChartData! in var point = TKChartFinancialDataPoint(x: item.valueForKey("Date"), open: formatter.numberFromString(item.valueForKey("Open")as! String), high: formatter.numberFromString(item.valueForKey("High")as! String), low: formatter.numberFromString(item.valueForKey("Low")as! String), close: formatter.numberFromString(item.valueForKey("Close")as! String), volume: formatter.numberFromString(item.valueForKey("Volume") as! String)) return point}Finally, we should set the dataSource property of the chart to our dataSource object and set up the xAxis to display date objects.
chart.dataSource = dataSourcelet xAxis = chart.xAxis as! TKChartDateTimeAxisxAxis.minorTickIntervalUnit = TKChartDateTimeAxisIntervalUnit.DaysxAxis.setPlotMode(TKChartAxisPlotMode.BetweenTicks)xAxis.majorTickInterval = 2 let yAxis = chart.yAxis as! TKChartNumericAxisyAxis.range.minimum = 25yAxis.majorTickInterval = 1You can set your imagination free and explore the other great options the TKChart and TKDataSource offer.
In case you want to continue where we left off, here is the full code of the example in Objective-C and Swift. To run the projects, download and install a free trial Telerik UI for iOS.
Enjoy!


Sophia Lazarova
Sophia Lazarova is a Junior Developer in the Telerik iOS Team. She recently graduated from the Telerik Academy with flying colors to join the team and start adding value to the suite of the best iOS controls. She is passionate about software development in various technologies.

