10 Chrome Developer Tool Features You May Have Missed

Summarize with AI:
Want to become an expert at Google Chrome developer tools? Take a look at these useful features you may have missed.
Google Chrome is a popular browser among frontend developers, and with its robust developer tools, it’s not hard to see why. But with such a broad selection of features, it’s easy for developers to gravitate to familiar favorites and miss out on lesser-known tools that make debugging faster and easier. While working on a recent project, I realized that I was in this position and spent some time digging into the Chrome DevTools. Here are a few of the most useful tips and features I found to help you make the most of this powerful tool.
1. Open Chrome DevTools with Control+Shift+I, and Other Helpful Shortcuts
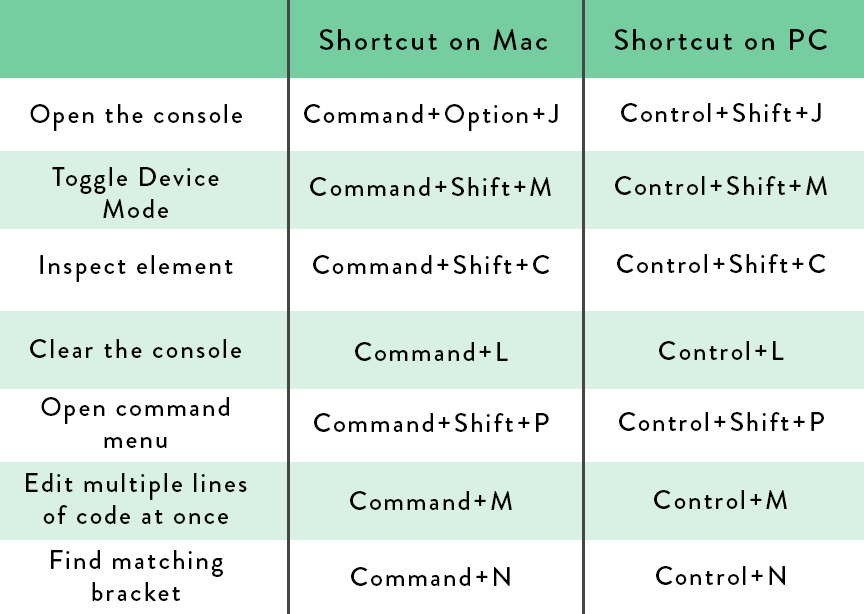
There are a few ways to access the DevTools. The first is opening the Chrome menu in the browser window, then clicking on “More Tools” and then “Developer Tools”. A faster way is right-clicking anywhere on the page (or Command-clicking on a Mac) and then selecting “Inspect”, which will bring up the element you clicked on in the Elements tab in the DevTools. The fastest way, however, is through a keyboard shortcut: Control+Shift+I on a PC, and Command+Option+I on a Mac. There are also several other helpful shortcuts to know:

For a full list of shortcuts, see the official documentation.
2. Add Reverse Breakpoints in the Elements Tab
If you’re debugging a page and suspect that a specific element is the cause, your first instinct may be to go to the Sources tab. But it’s also possible to create a breakpoint in reverse, by selecting the element rather than the line of code. This can be especially useful if an element is disappearing or appearing when you don’t expect it, and your code modifies multiple parts of the DOM, making it hard to see where exactly something is going wrong. A DOM breakpoint lets you get to the source of the problem directly.
To create a DOM breakpoint, use the element inspector (the arrow icon in the top-left corner of the DevTools) to click on, or inspect, a part of the page. Then right-click (or Command-click on a Mac) on the highlighted line of code and select “Break on…”. You’ll see three options.
- Subtree modifications will trigger when a child of the selected element is removed or added, or when a child’s content is changed.
- Attribute modifications will trigger when an attribute of the selected element is removed or added, or when its value is changed.
- Node removal will trigger when the selected element is removed.
3. Open a Color Picker or Change the Color Format in the Elements Styles Tab
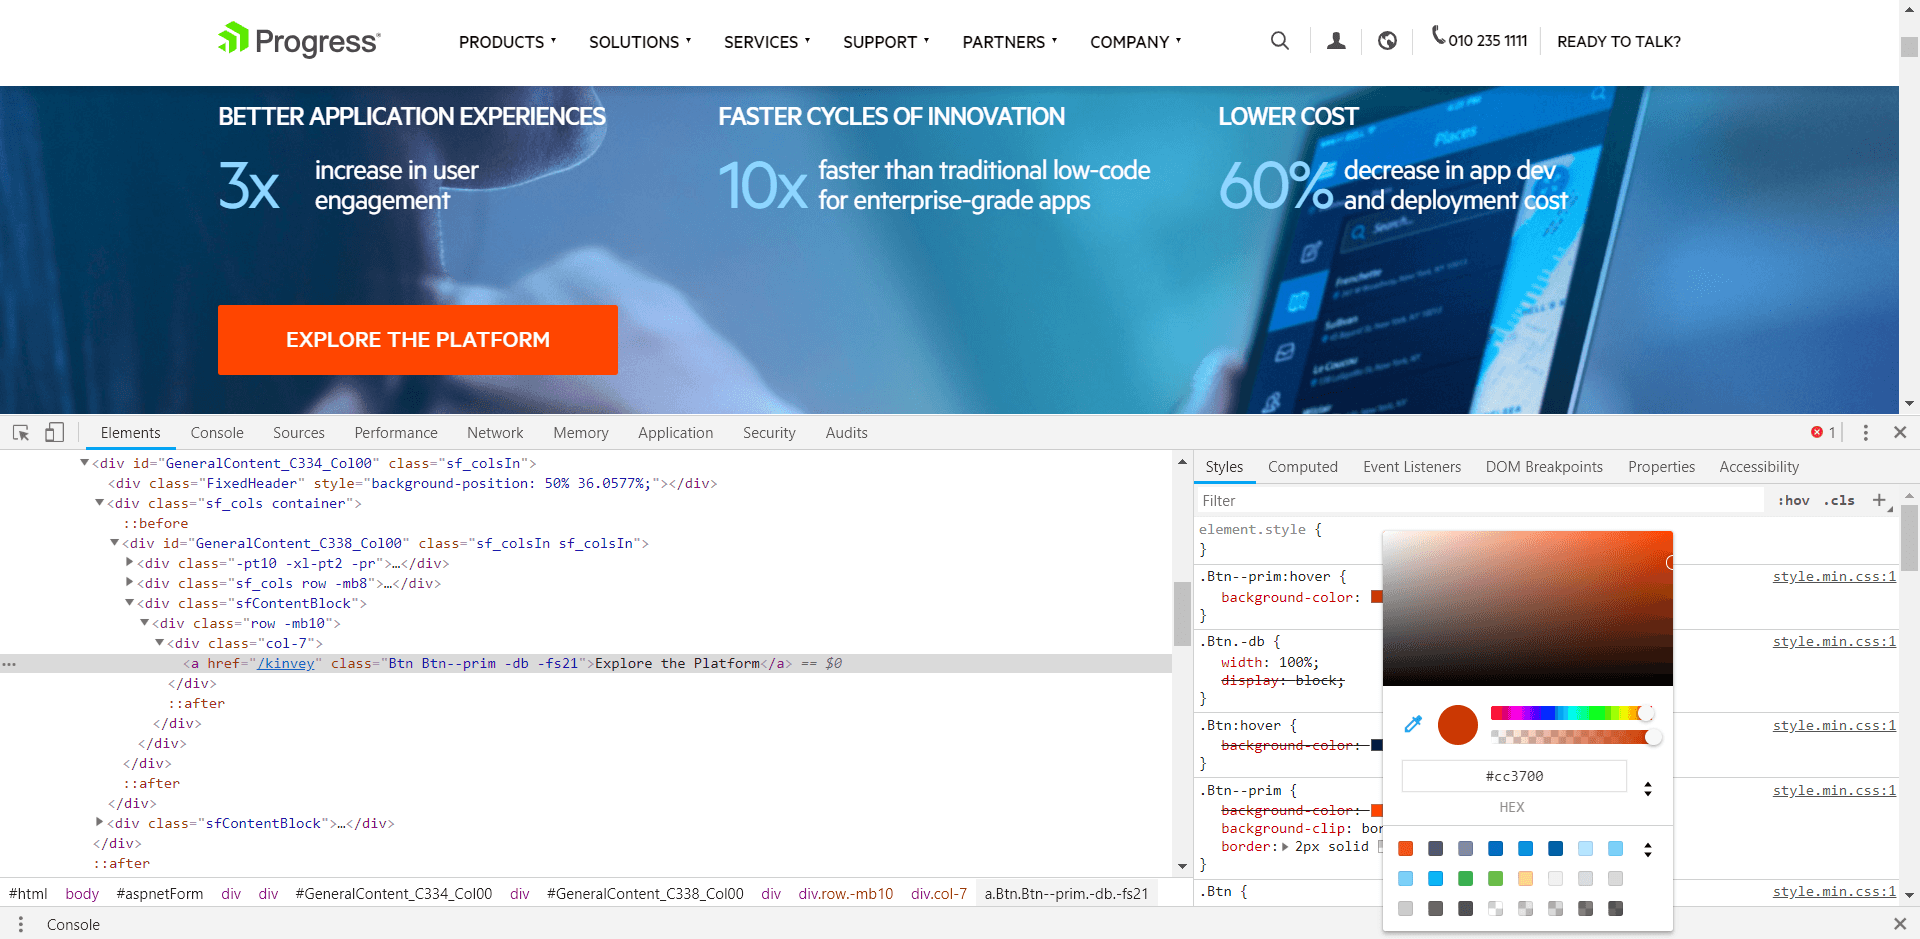
If you’ve selected an element that has a color attribute, that color will be visible in the bar on the right side of the elements tab. You can toggle styles for your inspect element on or off using the checkboxes, or edit them by double-clicking on them. For a color attribute, it’s also possible to open a color picker by double-clicking on the colored square next to the attribute. If you’d like to use a color from the page’s existing color palette, Chrome makes it easy; just click on the arrows to the left of the color palette and use colors from the Page Colors palette. Finally, if you’d like to see the color in a different format, by switching between hex and RGBA, for example, you can do so by Shift-clicking on the color square.

4. Access an Inspect Element in the Console Using the Temporary Variable $0
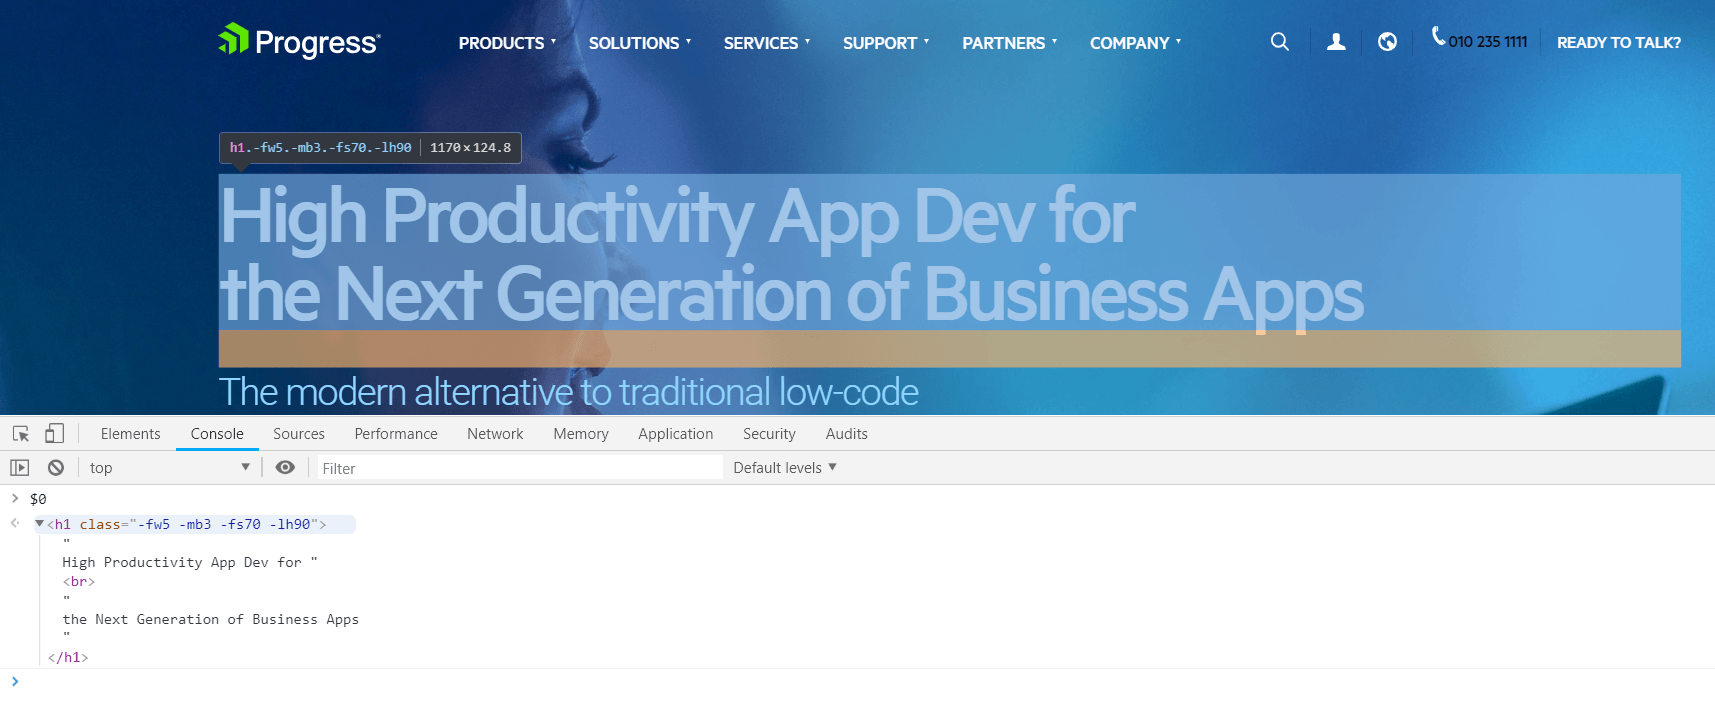
If you want to select an element in your console tab, you can avoid getting messy with document.getElementByID. Use the element inspector in the Elements tab to select the node, then click over to the Console tab and use the temporary element $0. You can also select the parent element using $1, and its parent using $2, etc.

5. Monitor Events on a Specific Element Using monitorEvents() in the Console
To monitor events on one node or element, you can use your console. The monitorEvents() function takes an HTML ID, and can also take specific kinds of events. For example, to monitor all events that happen to the document body, you could use monitorEvents(document.body), or to monitor only clicks on the body, use monitorEvents(document.body, ‘click’); the console will log the event object, so you can see its properties. You can also combine this with the last trick by first selecting an element using the element inspector, then typing monitorEvents($0). Use unmonitorEvents(document.body) to stop.
6. Set a Breakpoint at the Start of a Function Using the Console
If you’re interested in debugging a specific function, it’s possible to do so in the console itself. This can save time if you’re in a rush and don’t want to hunt down a specific function in your Sources panel, or when you don’t have the source files (for example, if you created the function in the console in the first place). Use the debug() function, passing your selected function’s name to debug() as an argument, like this: debug(myFunctionName). To remove the breakpoint, use undebug(myFunctionName).
7. In the Network Tab, See a Request’s Initiators and Dependencies By Holding Shift
To see the initiators and dependencies of a specific request, you can use the Network tab. In the tab, click on a request in the request table and hold Shift; initiators are highlighted green, and dependencies are highlighted red. You can read more in the official documentation.
8. Add Conditional Breakpoints Using Right-Click
It’s possible to create conditional breakpoints, which only fire when a certain condition is met. This can be very useful in debugging situations in which you have multiple breakpoints but are only interested in stepping into a function under some conditions, such as when a certain variable is true. To do this, create the breakpoint as you would normally, by clicking on the line number you’d like to break on in your Sources panel. Then right-click (or Command-click on a Mac) on the breakpoint and select ‘Edit breakpoint.’ Write a condition in the box that pops up, such as myVar == true; the breakpoint will only fire when that condition is met.
9. Add a Breakpoint Midline by Entering the Line
Sometimes it’s useful to break on a certain part of a line, rather than on the line itself. This can save time that would be spent stepping into each part of the code on that line, or, more importantly, break on one-line callback functions, such as on doSomething in the following function: setTimeout(() => { doSomething(a, b); }, 1000).
To create a midline breakpoint, go to your chosen line of code in the Sources panel. Click on the part of the line you’d like to break on, as though you want to edit the text. Then, click on the line number to create a breakpoint. You’ll see several smaller, gray breakpoint arrows appear, each at a different part of the line. Click on the one at the point in the line where you’d like to break to establish your midline breakpoint.
10. Evaluate Expressions and Variables When the Page is Paused
This tip is one of the most useful I’ve encountered for debugging. When your page is stuck on a breakpoint, you can see the current value of any expression or variable on the page by hovering over it. For combined expressions, select the whole or partial expression first, then hover over it.
This is especially useful when one of your variables isn’t returning the way that it should, because you can track, at each step of a function or line of code, what the value of the variable is and when it changes. While this tip may be the simplest to use, it’s possibly the most useful for frustrating debugging scenarios.
These tips are far from the only features that Chrome DevTools has to offer. If you’re interested in learning more about the developer tools and what they can do, I encourage you to read Google’s official Chrome documentation, or checkout Jon Kuperman’s Mastering Chrome Developer Tools workshop on Frontend Masters. Of course, the best way to get familiar with these tricks, and the many others out there, is to use them as you develop and debug. I encourage you to try out these tips and see which of them make your programming experience easier and more efficient.
For more info on building great web apps:
Want to learn more about creating great user interfaces? Check out Kendo UI - our complete UI component library that allows you to quickly build high-quality, responsive apps. It includes all the components you’ll need, from grids and charts to schedulers and dials.
Sara Wegman
Sara Wegman is a front-end developer working in the Hague, the Netherlands. She is the creator of the ComplimentDash Chrome extension and blogs about her programming progress at blog.sarawegman.com. You can follow her on Twitter at @SaraLaughed.
