New to Telerik UI for ASP.NET Core? Start a free 30-day trial
Plotbands
Updated on Dec 11, 2025
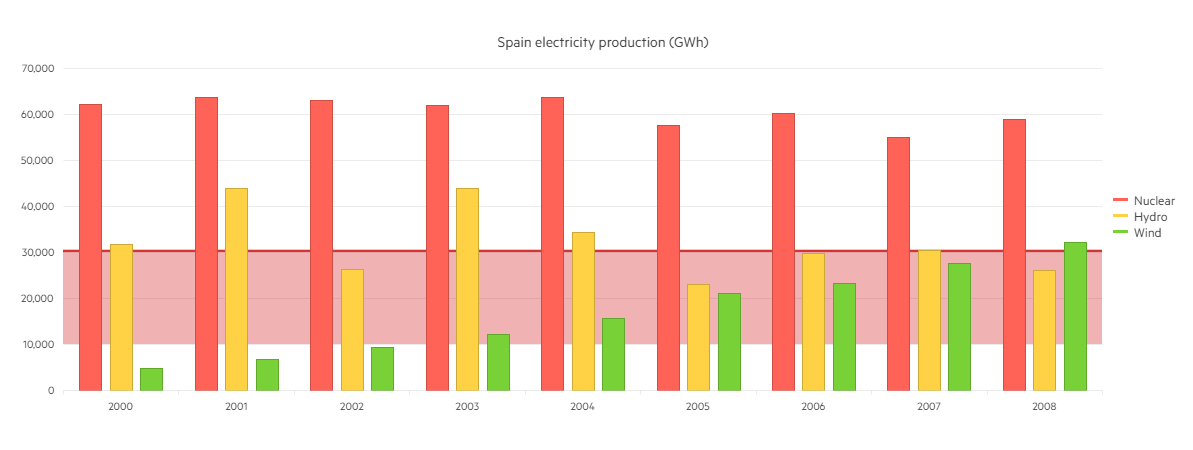
Plot Bands are colored ranges, which are used to highlight certain areas in the ASP.NET Core Chart. You can create them by setting:
ValueAxis -> PlotBands -> bands.Add().From(10000).To(30000).Color("#c00").Opacity(0.3);
Each Plot Band could be configured independently by specifying the following properties:
- From — the start position of the plot band.
- To — the end position of the plot band.
- Opacity — the opacity of the plot band.
- Color — the color of the plot band.
The following implementation demonstrates the code needed for setting Plotbands for Bar Chart:
Razor
 @(Html.Kendo().Chart<Kendo.Mvc.Examples.Models.ElectricityProduction>()
        .Name("chart")
        .Title("Spain electricity production (GWh)")
        .Legend(legend => legend
            .Position(ChartLegendPosition.Right)
        )
        .DataSource(ds => ds
            .Read(read => read.Action("_SpainElectricityProduction", "Bar_Charts"))
            .Sort(sort => sort.Add("Year").Ascending())
        )
        .Series(series =>
        {
            series.Column(model => model.Nuclear).Name("Nuclear").CategoryField("Year");
            series.Column(model => model.Hydro).Name("Hydro").CategoryField("Year");
            series.Column(model => model.Wind).Name("Wind").CategoryField("Year");
        })
        .CategoryAxis(axis => axis
            .MajorGridLines(lines => lines.Visible(false))
        )
        .ValueAxis(axis => axis.Numeric()
            .Labels(labels => labels.Format("{0:N0}"))
            .MajorUnit(10000)
            .Max(70000)
            .Line(line => line.Visible(false))
            .PlotBands(bands => {
                bands.Add().From(10000).To(30000).Color("#c00").Opacity(0.3);
                bands.Add().From(30000).To(30500).Color("#c00").Opacity(0.8);
            })
        )
        .Tooltip(tooltip => tooltip
            .Visible(true)
            .Format("{0:N0}")
        )
) Overview of Plotbands implementation for Bar Chart: