New to Telerik UI for WinUI? Start a free 30-day trial
Scatter Spline Series
Updated on Mar 26, 2026
The ScatterSplineSeries are represented on the chart as data points connected with smooth line segments.
ScatterSplineSeries class inherits from the ScatterLineSeries class - See the inherited properties.
Example
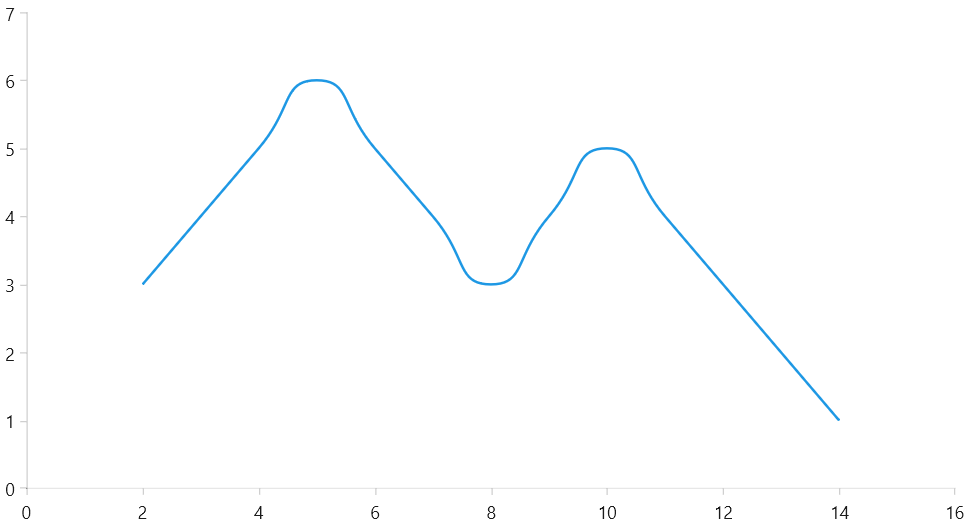
The following example shows how to create a RadCartesianChart with a ScatterSplineSeries.
Defining the model
C#
public class Data
{
	public double Category { get; set; }

	public double Value { get; set; }
}
Populating with data
C#
public MainPage()
{
	this.InitializeComponent();

	List<Data> sampleData = new List<Data>
	{
		new Data() { Category = 2, Value = 3 },
		new Data() { Category = 3, Value = 4 },
		new Data() { Category = 4, Value = 5 },
		new Data() { Category = 5, Value = 6 },
		new Data() { Category = 6, Value = 5 },
		new Data() { Category = 7, Value = 4 },
		new Data() { Category = 8, Value = 3 },
		new Data() { Category = 9, Value = 4 },
		new Data() { Category = 10, Value = 5 },
		new Data() { Category = 11, Value = 4 },
		new Data() { Category = 12, Value = 3 },
		new Data() { Category = 13, Value = 2 },
		new Data() { Category = 14, Value = 1 }
	};

	this.radCartesianChart.DataContext = sampleData;
}
Defining the RadCartesianChart and ScatterSplineSeries
XAML
<Grid xmlns:telerikChart="using:Telerik.UI.Xaml.Controls.Chart">
	<telerikChart:RadCartesianChart x:Name="radCartesianChart">
		<telerikChart:RadCartesianChart.VerticalAxis>
			<telerikChart:LinearAxis/>
		</telerikChart:RadCartesianChart.VerticalAxis>
		<telerikChart:RadCartesianChart.HorizontalAxis>
			<telerikChart:LinearAxis/>
		</telerikChart:RadCartesianChart.HorizontalAxis>

		<telerikChart:ScatterSplineSeries ItemsSource="{Binding}">
			<telerikChart:ScatterSplineSeries.XValueBinding>
				<telerikChart:PropertyNameDataPointBinding PropertyName="Category"/>
			</telerikChart:ScatterSplineSeries.XValueBinding>
			<telerikChart:ScatterSplineSeries.YValueBinding>
				<telerikChart:PropertyNameDataPointBinding PropertyName="Value"/>
			</telerikChart:ScatterSplineSeries.YValueBinding>
		</telerikChart:ScatterSplineSeries>
	</telerikChart:RadCartesianChart>
</Grid>
RadCartesianChart with a ScatterSplineSeries
Spline Tension
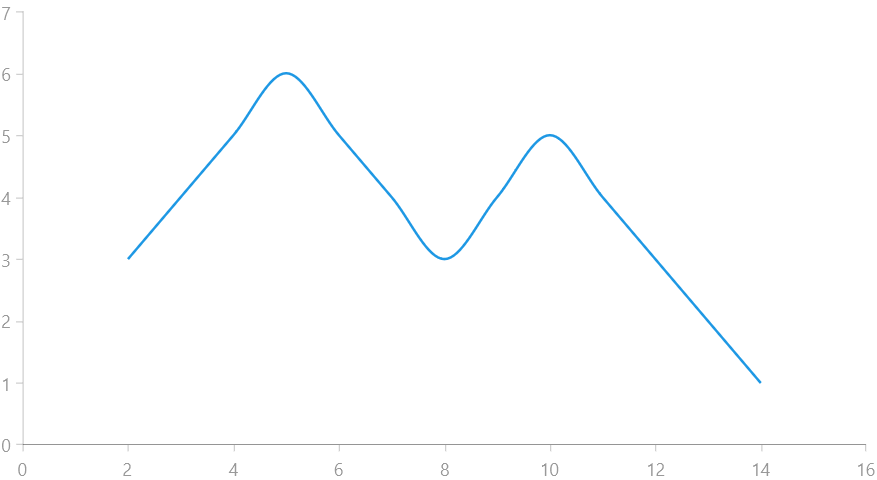
The spline-type series provides a property that allows you to control the tension of the spline. To do so, set the SplineTension property. The tension works with relative values between 0 and 1. The defualt tension is set to 0.5.
Setting the SplineTension property
XAML
<telerikChart:RadCartesianChart x:Name="radCartesianChart">
	<telerikChart:RadCartesianChart.VerticalAxis>
		<telerikChart:LinearAxis/>
	</telerikChart:RadCartesianChart.VerticalAxis>
	<telerikChart:RadCartesianChart.HorizontalAxis>
		<telerikChart:LinearAxis/>
	</telerikChart:RadCartesianChart.HorizontalAxis>

	<telerikChart:ScatterSplineSeries ItemsSource="{Binding}" SplineTension="0.9">
		<telerikChart:ScatterSplineSeries.XValueBinding>
			<telerikChart:PropertyNameDataPointBinding PropertyName="Category"/>
		</telerikChart:ScatterSplineSeries.XValueBinding>
		<telerikChart:ScatterSplineSeries.YValueBinding>
			<telerikChart:PropertyNameDataPointBinding PropertyName="Value"/>
		</telerikChart:ScatterSplineSeries.YValueBinding>
	</telerikChart:ScatterSplineSeries>
</telerikChart:RadCartesianChart>
ScatterSplineSeries with modified SplineTension