New to Telerik UI for WinUI? Start a free 30-day trial
Scatter Line Series
Updated on Mar 26, 2026
The ScatterLineSeries are represented on the chart as data points connected with straight line segments.
Properties
ScatterLineSeries class inherits from the ScatterPointSeries class -
- Stroke (Brush): Gets or sets the Brush instance that defines the stroke of the line used to present the series.
- StrokeThickness (double): Gets or sets the thickness of the line used to present the series.
Example
Examples 1, 2 and 3 show how to implement a RadCartesianChart with a ScatterLineSeries.
Example 1: Defining the model
C#
public class Data
{
	public double XValue { get; set; }

	public double YValue { get; set; }
}
Example 2: Populating with data
C#
List<Data> sampleData = new List<Data>();
sampleData.Add(new Data() { XValue = 2, YValue = 3 });
sampleData.Add(new Data() { XValue = 3, YValue = 4 });
sampleData.Add(new Data() { XValue = 4, YValue = 5 });
sampleData.Add(new Data() { XValue = 5, YValue = 6 });
sampleData.Add(new Data() { XValue = 6, YValue = 5 });
sampleData.Add(new Data() { XValue = 7, YValue = 4 });
sampleData.Add(new Data() { XValue = 8, YValue = 3 });
sampleData.Add(new Data() { XValue = 9, YValue = 4 });
sampleData.Add(new Data() { XValue = 10, YValue = 5 });
sampleData.Add(new Data() { XValue = 11, YValue = 4 });
sampleData.Add(new Data() { XValue = 12, YValue = 3 });
sampleData.Add(new Data() { XValue = 13, YValue = 2 });
sampleData.Add(new Data() { XValue = 14, YValue = 1 });

this.scatterLineSeries.DataContext = sampleData;
Example 3: Defining the RadCartesianChart and ScatterLineSeries
XAML
<Grid xmlns:telerikChart="using:Telerik.UI.Xaml.Controls.Chart">
<telerikChart:RadCartesianChart x:Name="scatterLineSeries">
<telerikChart:RadCartesianChart.VerticalAxis>
<telerikChart:LinearAxis/>
</telerikChart:RadCartesianChart.VerticalAxis>
<telerikChart:RadCartesianChart.HorizontalAxis>
<telerikChart:LinearAxis/>
</telerikChart:RadCartesianChart.HorizontalAxis>
<telerikChart:ScatterLineSeries ItemsSource="{Binding}">
<telerikChart:ScatterLineSeries.XValueBinding>
<telerikChart:PropertyNameDataPointBinding PropertyName="XValue"/>
</telerikChart:ScatterLineSeries.XValueBinding>
<telerikChart:ScatterLineSeries.YValueBinding>
<telerikChart:PropertyNameDataPointBinding PropertyName="YValue"/>
</telerikChart:ScatterLineSeries.YValueBinding>
</telerikChart:ScatterLineSeries>
</telerikChart:RadCartesianChart>
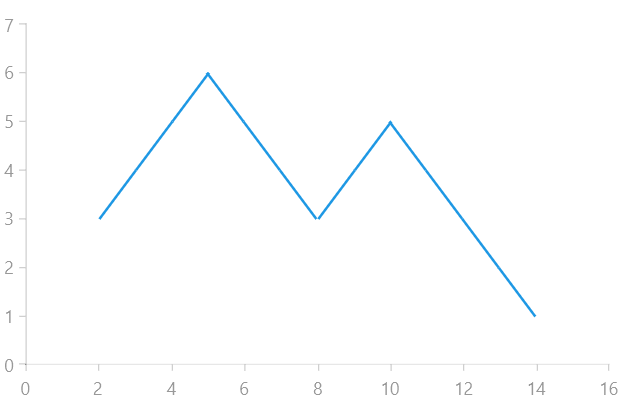
</Grid>Figure 1: Result from Example 3