New to Telerik UI for WinUI? Start a free 30-day trial
Scatter Point Series
Updated on Mar 26, 2026
The ScatterPointSeries are represented on the chart as unconnected data points presented by an arbitrary Template. Each scatter data point has X and Y values which make the position of the data point in the data source and its location on the plot area unrelated. For example the third data point in the data source may appear before the first data point when plotted. There are also scatter line and scatter area series which behave in the exact same way with the only (visual) difference that the points define a line and area respectively.
Properties
ScatterPointSeries class inherits from the CartesianSeries class -
- DataPoints: Gets the collection of data points associated with the series.
- XValueBinding: Gets or sets the binding that will be used to fill the XValue of ScatterDataPoint members of the DataPoints collection.
- YValueBinding: Gets or sets the binding that will be used to fill the YValue of ScatterDataPoint members of the DataPoints collection.
Example
Examples 1, 2 and 3 show how to implement a RadCartesianChart with the ScatterPoint Series.
Example 1: Defining the model
C#
public class Data
{
	public double XValue { get; set; }

	public double YValue { get; set; }
}
Example 2: Populating with data
C#
List<Data> sampleData = new List<Data>();
sampleData.Add(new Data() { XValue = 2, YValue = 3 });
sampleData.Add(new Data() { XValue = 3, YValue = 4 });
sampleData.Add(new Data() { XValue = 4, YValue = 5 });
sampleData.Add(new Data() { XValue = 5, YValue = 6 });
sampleData.Add(new Data() { XValue = 6, YValue = 5 });
sampleData.Add(new Data() { XValue = 7, YValue = 4 });
sampleData.Add(new Data() { XValue = 8, YValue = 3 });
sampleData.Add(new Data() { XValue = 9, YValue = 4 });
sampleData.Add(new Data() { XValue = 10, YValue = 5 });
sampleData.Add(new Data() { XValue = 11, YValue = 4 });
sampleData.Add(new Data() { XValue = 12, YValue = 3 });
sampleData.Add(new Data() { XValue = 13, YValue = 2 });
sampleData.Add(new Data() { XValue = 14, YValue = 1 });
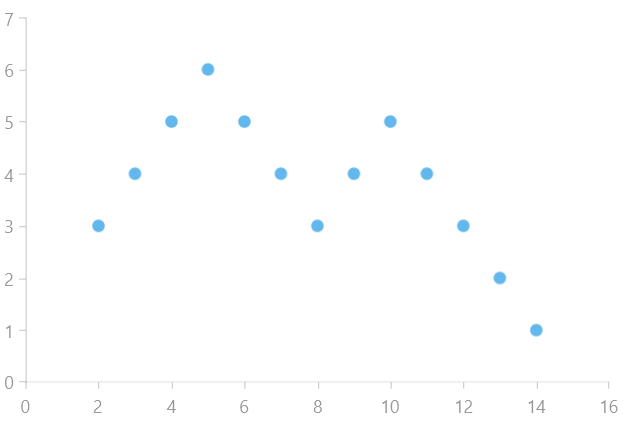
this.scatterPointSeries.DataContext = sampleData;Example 3: Defining the RadCartesianChart and ScatterPointSeries
XAML
<Grid xmlns:telerikChart="using:Telerik.UI.Xaml.Controls.Chart">
	<telerikChart:RadCartesianChart x:Name="scatterPointSeries">
		<telerikChart:RadCartesianChart.VerticalAxis>
			<telerikChart:LinearAxis/>
		</telerikChart:RadCartesianChart.VerticalAxis>
		<telerikChart:RadCartesianChart.HorizontalAxis>
			<telerikChart:LinearAxis/>
		</telerikChart:RadCartesianChart.HorizontalAxis>

		<telerikChart:ScatterPointSeries ItemsSource="{Binding}">
			<telerikChart:ScatterPointSeries.XValueBinding>
				<telerikChart:PropertyNameDataPointBinding PropertyName="XValue"/>
			</telerikChart:ScatterPointSeries.XValueBinding>
			<telerikChart:ScatterPointSeries.YValueBinding>
				<telerikChart:PropertyNameDataPointBinding PropertyName="YValue"/>
			</telerikChart:ScatterPointSeries.YValueBinding>
		</telerikChart:ScatterPointSeries>
	</telerikChart:RadCartesianChart>
</Grid>
Figure 1: Result from Example 3