New to Telerik UI for WPF? Start a free 30-day trial
Overview
Updated over 1 year ago
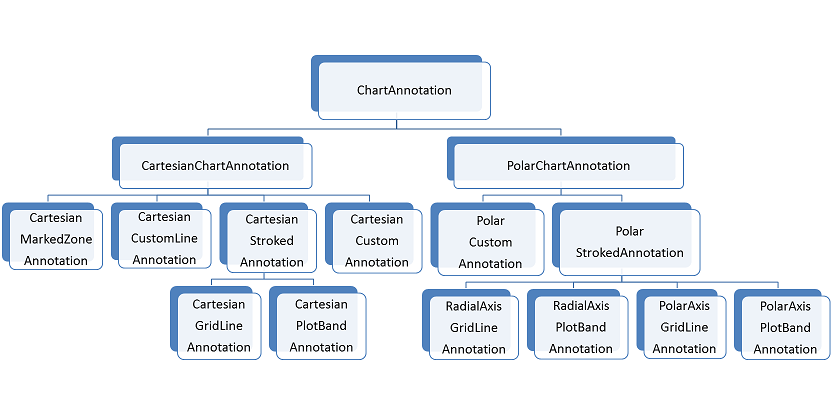
Annotations are visual elements that can be used highlight certain areas on the plot area and denote statistical significance.
The ChartView provides the following types of annotations:
-
Cartesian GridLine
-
Cartesian PlotBand
-
Cartesian Custom
-
Cartesian MarkedZone
-
Cartesian CustomLine
-
Polar Axis GridLine (associated with the polar axis)
-
Polar Axis PlotBand (associated with the polar axis)
-
Radial Axis GridLine (associated with the radial axis)
-
Radial Axis PlotBand (associated with the radial axis)
-
Polar Custom