New to Telerik UI for WPF? Start a free 30-day trial
Categorical Axis
Updated on Sep 23, 2026
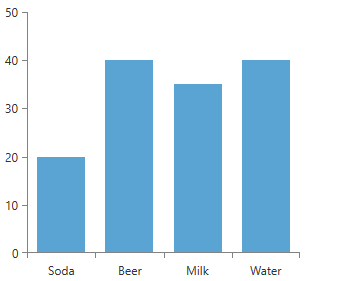
The categorical axis displays a set of categories. The values for each category do not define the order in which they appear. Here is an example of a categorical axis with a few data points.
Example 1: Chart with categorical axis
XAML
<telerik:RadCartesianChart>
    <telerik:RadCartesianChart.HorizontalAxis>
        <telerik:CategoricalAxis/>
    </telerik:RadCartesianChart.HorizontalAxis>

    <telerik:RadCartesianChart.VerticalAxis>
        <telerik:LinearAxis/>
    </telerik:RadCartesianChart.VerticalAxis>

    <telerik:RadCartesianChart.Series>
        <telerik:BarSeries>
            <telerik:BarSeries.DataPoints>
                <telerik:CategoricalDataPoint Category="Soda" Value="20"/>
                <telerik:CategoricalDataPoint Category="Beer" Value="40"/>
                <telerik:CategoricalDataPoint Category="Milk" Value="35"/>
                <telerik:CategoricalDataPoint Category="Water" Value="40"/>
            </telerik:BarSeries.DataPoints>
        </telerik:BarSeries>
    </telerik:RadCartesianChart.Series>
</telerik:RadCartesianChart>
Figure 1: Result from Example 1
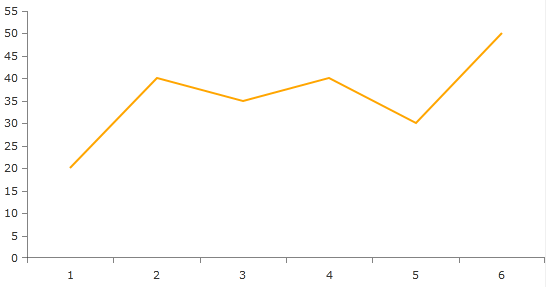
If a data point category is not defined, the series will set a category automatically. The category will be a numeric value determined by the position of the data point in the data source. For example, "1", "2", "3",etc."
Example 2: Chart with no category defined for datapoints
XAML
<telerik:RadCartesianChart x:Name="chart">
    <telerik:RadCartesianChart.HorizontalAxis>
        <telerik:CategoricalAxis/>
    </telerik:RadCartesianChart.HorizontalAxis>

    <telerik:RadCartesianChart.VerticalAxis>
        <telerik:LinearAxis/>
    </telerik:RadCartesianChart.VerticalAxis>

    <telerik:RadCartesianChart.Series>

        <telerik:LineSeries Stroke="Orange" StrokeThickness="2">
            <telerik:LineSeries.DataPoints>
                <telerik:CategoricalDataPoint Value="20"/>
                <telerik:CategoricalDataPoint Value="40"/>
                <telerik:CategoricalDataPoint Value="35"/>
                <telerik:CategoricalDataPoint Value="40"/>
                <telerik:CategoricalDataPoint Value="30"/>
                <telerik:CategoricalDataPoint Value="50"/>
            </telerik:LineSeries.DataPoints>
        </telerik:LineSeries>
    </telerik:RadCartesianChart.Series>
</telerik:RadCartesianChart>
Figure 2: Result from Example 2
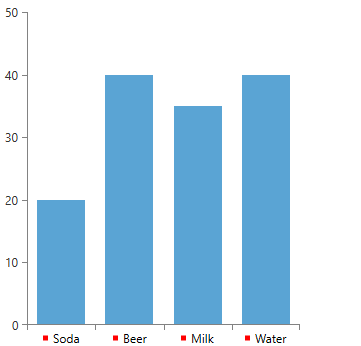
You can customize the CategoricalAxis by utilizing its LabelTemplate property. Here is a simple implementation of a rectangle added in the LabelTemplate.
Example 3: CategoricalAxis with LabelTemplate
XAML
<Grid>
    <Grid.Resources>
        <DataTemplate x:Key="LabelTemplate" DataType="{x:Type telerik:CategoricalAxis}">
            <StackPanel Orientation="Horizontal">
                <Rectangle Fill="Red" Width="5" Height="5" />
                <TextBlock Text="{Binding}" Margin="5 0 0 0" />
            </StackPanel>
        </DataTemplate>
    </Grid.Resources>

    <telerik:RadCartesianChart x:Name="RadChart">
        <telerik:RadCartesianChart.HorizontalAxis>
            <telerik:CategoricalAxis LabelTemplate="{StaticResource LabelTemplate}" />
        </telerik:RadCartesianChart.HorizontalAxis>

        <telerik:RadCartesianChart.VerticalAxis>
            <telerik:LinearAxis/>
        </telerik:RadCartesianChart.VerticalAxis>

        <telerik:RadCartesianChart.Series>
            <telerik:BarSeries>

                <telerik:BarSeries.DataPoints>
                    <telerik:CategoricalDataPoint Category="Soda" Value="20"/>
                    <telerik:CategoricalDataPoint Category="Beer" Value="40"/>
                    <telerik:CategoricalDataPoint Category="Milk" Value="35"/>
                    <telerik:CategoricalDataPoint Category="Water" Value="40"/>
                </telerik:BarSeries.DataPoints>

            </telerik:BarSeries>
        </telerik:RadCartesianChart.Series>
    </telerik:RadCartesianChart>
</Grid>
Figure 3: Result from Example 3