Display PointMarks and Labels for Specific points only
This help article will show you how to show PointMarks and Labels for specific points of Line Chart due to some condition - on every fifth day (assuming that on XAxis you have days of the month displayed).
To learn more about showing DateTime values on XAxis please read the DateTime support section.
- Create a new class named Data, which implements the INotifyPropertyChanged interface. It will be used as an ItemsSource for the chart control. The class has three properties:
-
Date - will be displayed on the X axis.
-
YValue - will be displayed on the Y axis.
-
PointMarkVisibility - will be applied to the PointMark Style (Visibility property).
	public class Data : INotifyPropertyChanged
	{
	  private DateTime _date;
	  private Visibility _pointMarkVisibility;
	  private int _yvalue;
	  public Data(DateTime date, int yvalue)
	  {
	   this._date = date;
	   this._yvalue = yvalue;
	   this.UpdatePointMarkVisibility();
	  }
	  public event PropertyChangedEventHandler PropertyChanged;
	  public DateTime Date
	  {
	   get
	   {
	     return _date;
	   }
	   set
	   {
	    if (this._date == value)
	    return;
	    this._date = value;
	    this.OnPropertyChanged("Date");
	   }
	 }
	   public int YValue
	   {
	     get
	      {
	       return _yvalue;
	       }
	    set
	     {
	      if (this._yvalue == value)
	      return;
	      this._yvalue = value;
	      this.OnPropertyChanged("YValue");
	     }
	   }
	   public Visibility PointMarkVisibility
	   {
	    get
	     {
	      return _pointMarkVisibility;
	     }
	    private set
	     {
	      if (object.Equals(this._pointMarkVisibility, value))
	      return;
	      this._pointMarkVisibility = value;
	      this.OnPropertyChanged("PointMarkVisibility");
	     }
	  }
	   protected virtual void OnPropertyChanged(string propertyName)
	   {
	     if (this.PropertyChanged != null)
	     this.PropertyChanged(this, new PropertyChangedEventArgs(propertyName));
	   }
	   private void UpdatePointMarkVisibility()
	   {
	     if (this.Date.Day%5 != 0)
	     this.PointMarkVisibility = Visibility.Collapsed;
	     else
	     this.PointMarkVisibility = Visibility.Visible;
	   }
}Note the *UpdatePointMarkVisibility *method called in the constructor of the class which sets PointMarkVisibility property to visible only if the Day is dividable by 5, which is our condition to show Point Marks.
Add a new chart declaration to your XAML:
<telerik:RadChart x:Name="chart"/>- Add the PointMark Style between the UserControl starting and ending tag. Add *Visibility *Property databound to DataItem.PointMarksVisibility property of the class. Here is how the Style should look like:
	<Style x:Key="MyPointMark_Style" TargetType="telerik:PointMark">
	    <Setter Property="Template">
	        <Setter.Value>
	            <ControlTemplate TargetType="telerik:PointMark">
	                <Canvas>
	                    <Path x:Name="PART_PointMarkPath"
	            Canvas.Left="{TemplateBinding PointMarkCanvasLeft}"
	            Canvas.Top="{TemplateBinding PointMarkCanvasTop}"
	            Style="{TemplateBinding ShapeStyle}"
	            Width="{TemplateBinding Size}"
	            Height="{TemplateBinding Size}"
	            Visibility="{Binding DataItem.PointMarkVisibility}"
	            Stretch="Fill">
	                        <Path.Data>
	                            <PathGeometry x:Name="PART_PointMarkPathGeometry" />
	                        </Path.Data>
	                    </Path>
	                </Canvas>
	            </ControlTemplate>
	        </Setter.Value>
	    </Setter>
</Style>- The chart will be built in the code-behind and White Space String will be assigned to every point's Label if it's Day is not dividable by 5:
	List<Data> exportData = new List<Data>();
	DateTime baseDate = new DateTime(2011, 1, 1);
	Random r = new Random();
	for (int i = 0; i < 30; i++)
	{
	    exportData.Add(new Data(baseDate.AddDays(i), r.Next(-10, 20)));
	}

	SeriesMapping mapping = new SeriesMapping();
	mapping.ItemMappings.Add(new ItemMapping("YValue", DataPointMember.YValue));
	mapping.ItemMappings.Add(new ItemMapping("Date", DataPointMember.XCategory));
	chart.ItemsSource = exportData;
	chart.SeriesMappings.Add(mapping);
	chart.DefaultView.ChartArea.AxisX.IsDateTime = true;

	chart.DefaultView.ChartArea.AxisX.LabelRotationAngle = 45;
	chart.DefaultView.ChartArea.AxisX.DefaultLabelFormat = "dd-MM-yy";

	LineSeriesDefinition line = new LineSeriesDefinition();
	chart.DefaultSeriesDefinition = line;
	line.ShowPointMarks = true;
	line.ShowItemLabels = true;
	chart.DefaultSeriesDefinition.PointMarkItemStyle = this.Resources["MyPointMark_Style"] as Style;
	chart.DataBound += (o, e) =>
	{
	    var dataSeries = chart.DefaultView.ChartArea.DataSeries.FirstOrDefault();
	    if (dataSeries != null)
	    {
	        foreach (var point in dataSeries.ToList())
	        {
	            DateTime myDate = DateTime.Parse(point.XCategory);
	            if (myDate.Day % 5 != 0)
	            {
	                point.Label = " ";
	            }
	        }
	    }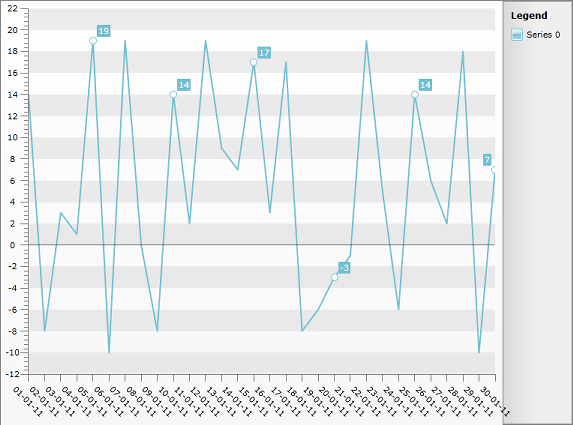
};The result can be seen on the image below: