Format Expressions
RadChart supports format expressions, which you can use to format the series items labels, axes labels and tooltip texts. Besides the standard, the custom numeric and the date/time format strings, RadChart supports chart specific format mechanism that allows you to insert context-specific data. To do that, use one of the following tokens:
| Token | Use for | Value |
|---|---|---|
| #Y | Series Items Label, Tooltip | DataPoint.YValue |
| #X | Series Items Label, Tooltip | DataPoint.XValue |
| #XCAT | Series Items Label, Tooltip | DataPoint.XCategory |
| #HIGH | Series Items Label, Tooltip | DataPoint.High |
| #LOW | Series Items Label, Tooltip | DataPoint.Low |
| #OPEN | Series Items Label, Tooltip | DataPoint.Open |
| #CLOSE | Series Items Label, Tooltip | DataPoint.Close |
| #BUBBLESIZE | Series Items Label, Tooltip | DataPoint.BubbleSize |
| #LABEL | Series Items Label, Tooltip | DataPoint.Label |
| #LEGENDLABEL | Series Items Label, Tooltip | DataPoint.LegendLabel |
| #TOOLTIP | Series Items Label, Tooltip | DataPoint.Tooltip |
| #SERIESLABEL | Series Items Label, Tooltip | DataSeries.LegendLabel |
| #% | Series Items Label, Tooltip | DataPoint.YValue / (The sum of all YValues in the current data series) |
| #STSUM | Series Items Label, Tooltip | Represents the sum of all stacked items for a given index. |
| #STPERCENT | Series Items Label, Tooltip | The percent representation of the value of a given item with respect to all stacked items for the respective index. |
| #DATAITEM. | Series Items Label, Tooltip | Use it to access the DataPoint.DataItem and read the value from a property of the underlying business object. |
| #VAL | X-Axis, Y-Axis | TickPoint.Value. This will work only when formatting axis labels. |
As you can see, each token consists of two parts: number sign "#" and name. Additionally, in a curly braces, you can specify the format of the value if needed.
The #DATAITEM token is a special one. It allows you to specify a property name from the underlying object and when the format expression is applied, the #DATAITEM token will be replaced with the value from the corresponding property. The format is: #DATAITEM.
Besides the format expressions, you can specify how the labels to be formatted by using ChartArea.LabelFormatBehavior. You can select one of the three options: HumanReadable(default), Scientific and None. However, the format expressions override the selected LabelFormatBehavior. More about the label format behavior you can find here.
Specifying Label Formats
The following example demonstrates how to specify a label format expression to customize the axes, the series item labels and the tooltips.
The created chart is bound to a collection of TradeData objects via SeriesMapping/ItemMapping, where the TradeData object has the following structure:
	public class TradeData
	{
	    public string Emission
	    {
	        get;
	        set;
	    }
	    public DateTime FromDate
	    {
	        get;
	        set;
	    }
	    public DateTime ToDate
	    {
	        get;
	        set;
	    }
	    public double Open
	    {
	        get;
	        set;
	    }
	    public double High
	    {
	        get;
	        set;
	    }
	    public double Low
	    {
	        get;
	        set;
	    }
	    public double Close
	    {
	        get;
	        set;
	    }
	    public double Volume
	    {
	        get;
	        set;
	    }
	    public string Comment
	    {
	        get;
	        set;
	    }
}Take a look at the code snippet below and see how to define custom label format strings for your RadChart.
<telerik:RadChart x:Name="radChart">
<telerik:RadChart.DefaultView>
<telerik:ChartDefaultView>
<telerik:ChartDefaultView.ChartArea>
<telerik:ChartArea>
<telerik:ChartArea.AxisX>
<telerik:AxisX DefaultLabelFormat="dd-MMM" LayoutMode="Inside" />
</telerik:ChartArea.AxisX>
<telerik:ChartArea.AxisY>
<telerik:AxisY DefaultLabelFormat="#VAL{C2}" />
</telerik:ChartArea.AxisY>
</telerik:ChartArea>
</telerik:ChartDefaultView.ChartArea>
<!-- .... -->
</telerik:ChartDefaultView>
</telerik:RadChart.DefaultView>
<telerik:RadChart.SeriesMappings>
<telerik:SeriesMapping LegendLabel="MSFT">
<telerik:SeriesMapping.SeriesDefinition>
<telerik:LineSeriesDefinition ItemLabelFormat="#Y{C2}"
ItemToolTipFormat="High/Low: #DATAITEM.High{C4}/#DATAITEM.Low{C4}
Volume: #DATAITEM.Volume{#,###,###,##0}"
ShowItemLabels="True"
ShowItemToolTips="True" />
</telerik:SeriesMapping.SeriesDefinition>
<telerik:SeriesMapping.ItemMappings>
<telerik:ItemMapping DataPointMember="YValue" FieldName="Close" />
<telerik:ItemMapping DataPointMember="XValue" FieldName="FromDate" />
</telerik:SeriesMapping.ItemMappings>
</telerik:SeriesMapping>
</telerik:RadChart.SeriesMappings>
</telerik:RadChart> RadChart radChart = new RadChart();
//....
radChart.DefaultView.ChartArea.AxisX.DefaultLabelFormat = "dd-MMM";
radChart.DefaultView.ChartArea.AxisX.LayoutMode = AxisLayoutMode.Inside;
radChart.DefaultView.ChartArea.AxisY.DefaultLabelFormat = "#VAL{C2}";
SeriesMapping seriesMapping = new SeriesMapping();
seriesMapping.SeriesDefinition = new LineSeriesDefinition();
seriesMapping.SeriesDefinition.ShowItemToolTips = true;
seriesMapping.SeriesDefinition.ItemLabelFormat = "#Y{C2}";
seriesMapping.SeriesDefinition.ItemToolTipFormat =
"High/Low: #DATAITEM.High{C4}/#DATAITEM.Low{C4}\nVolume: #DATAITEM.Volume{#,###,###,##0}";
seriesMapping.ItemMappings.Add( new ItemMapping( "Close", DataPointMember.YValue ) );
seriesMapping.ItemMappings.Add( new ItemMapping( "FromDate", DataPointMember.XValue ) );
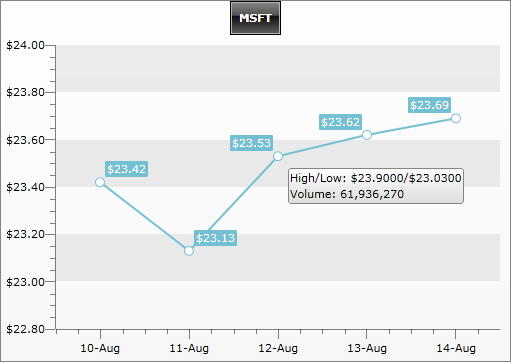
radChart.SeriesMappings.Add( seriesMapping );The specified label formats are:
-
The X-Axis format is set to "dd-MMM". It does not use any tokens, just the standard DateTime formatting to show the day and the three letter abbreviation of the month.
-
The Y-Axis uses #VAL token with currency format: "#VAL{C2}". As a result, the label shows the tick's value formatted as currency with two digits after the decimal point.
-
The series item labels are showing the value from the DataPoint.Close property formatted as currency: "#Y{C2}".
-
The tooltip is formatted to show two rows. On the first row, the High and the Low values are shown, while on the second - the volume. When the format string is set declaratively, you have to use " " for new line. When it is set in the code behind - "\n":
-
"High/Low: #DATAITEM.High{C4}/#DATAITEM.Low{C4} Volume: #DATAITEM.Volume{#,###,###,##0}"
-
"High/Low: #DATAITEM.High{C4}/#DATAITEM.Low{C4}\nVolume: #DATAITEM.Volume{#,###,###,##0}"
The result is shown on the image below. Note that the YValue is bound to the Close property of the underlying business object, while the tooltip using the #DATAITEM token extracts the values from from the High, Low and Volume properties and then applies the specified format:
The #TOOLTIP token is intended to be used when formatting items labels via ItemLabelFormat. This token returns the value from the DataPoint.Tooltip property. More about tooltip formatting see here.
On the table below you can see some more examples of format expressions:
| Expression | Result |
|---|---|
| C4 | 1234.211 |
| #,##0.00 | 1,234.21 |
| #VAL{C2} | $1,234.21 |
| Open: #OPEN{C2} | Open: $1234.21 |
| #%{p} | 12.34% |
| Volume: #DATAITEM.Volume{#,###,##0} | Volume: 1,234,567 |